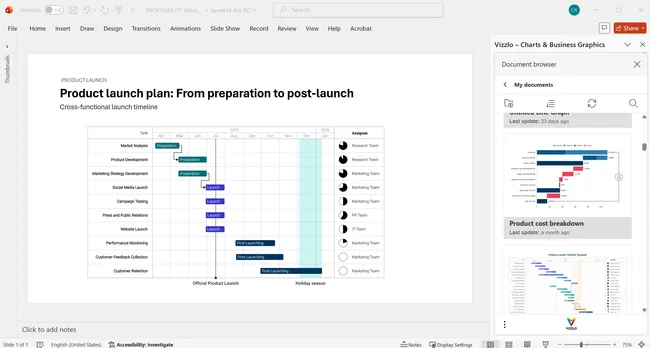







One tool for marketing data,
plans and presentations
Turn campaign results, launch plans and marketing insights into clear, on-brand visuals.
-
 Report performance faster
-
 Communicate plans clearly
-
 Stay on brand
From marketing data to clear insights
-
Start with your data
Paste your data or import it from your workflow.
-
Choose the right chart
Choose the chart that fits your message.
-
Highlight the takeaway
Focus attention on what matters most.
-
Present anywhere
Present in PowerPoint, Google Slides, or export your charts.
Charts for marketing data and plans
Choose from 120+ chart types for reporting, forecasting, and performance analysis


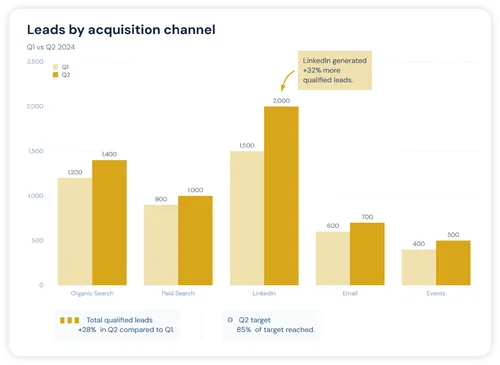
Make performance easier to explain
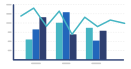
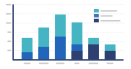
Marketing reporting is more than showing metrics. Make it clear what worked, what changed and where to focus next.
- Compare performance
- Show the trend
- Add context
- Highlight what matters
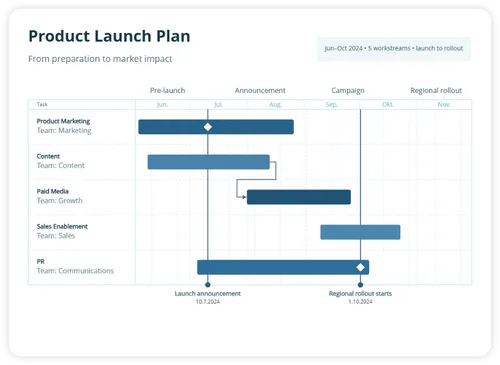
Keep every launch on track
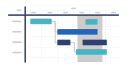
Bring timelines, milestones, channels and priorities into one clear visual — so everyone knows what happens next.
- Plan the rollout
- Align teams
- Track milestones
- Share the plan
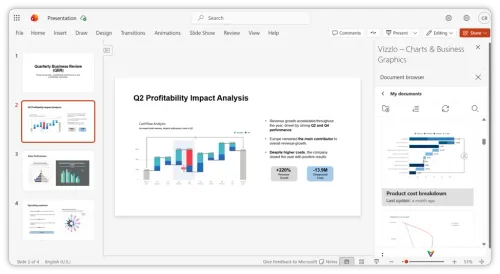
Built for the way marketing teams already present
Create and edit charts in PowerPoint, Google Slides or your browser — or export them wherever you need.


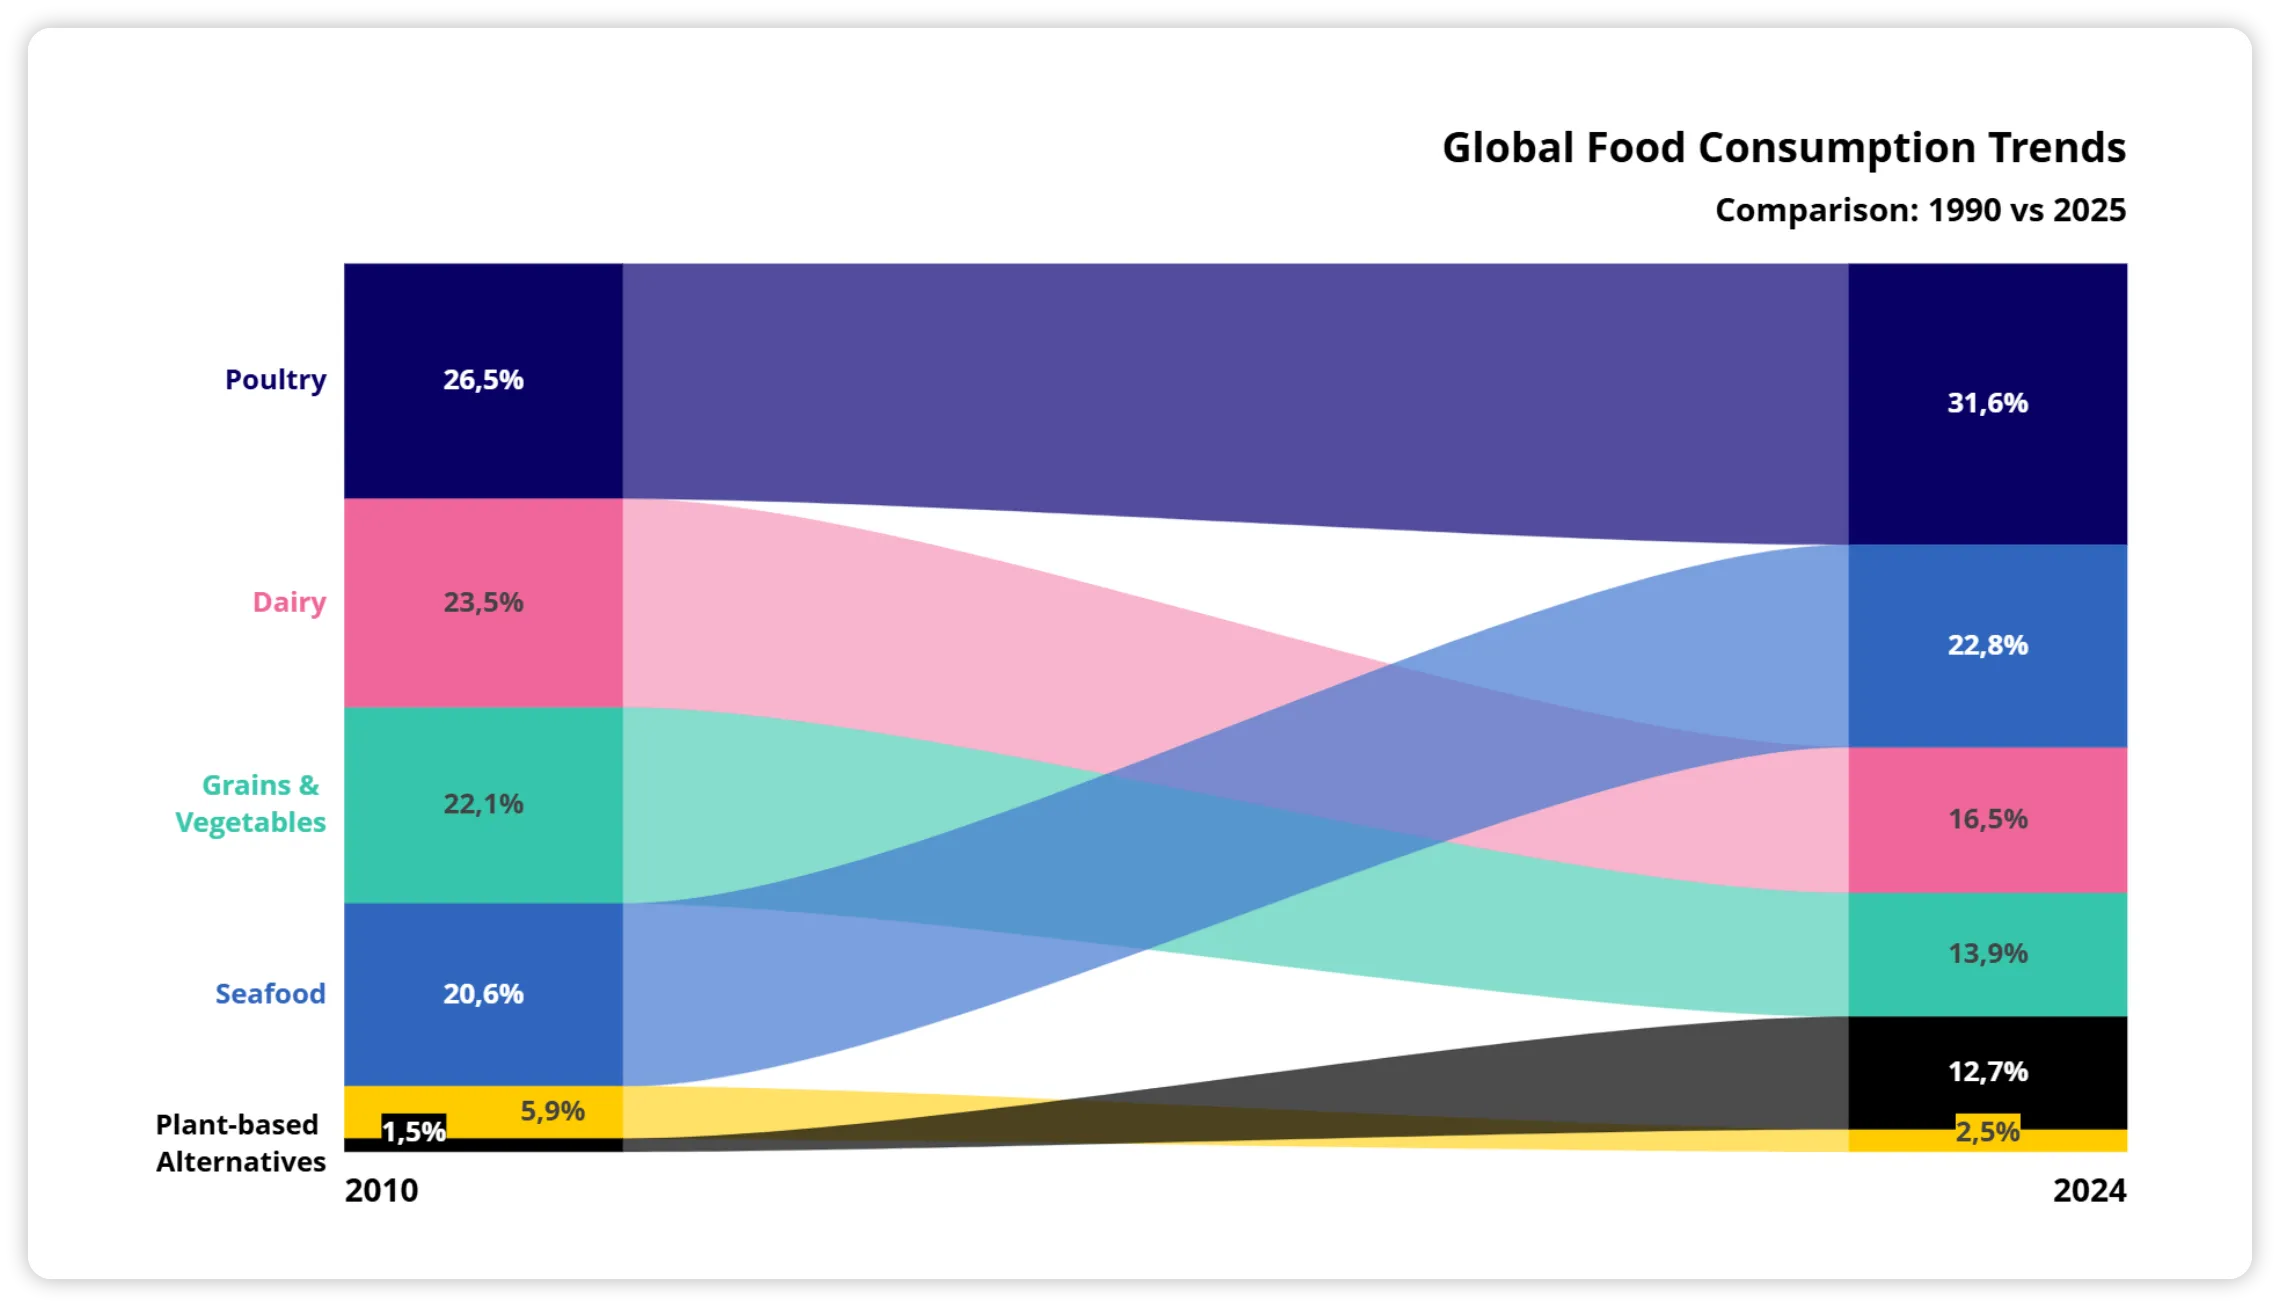
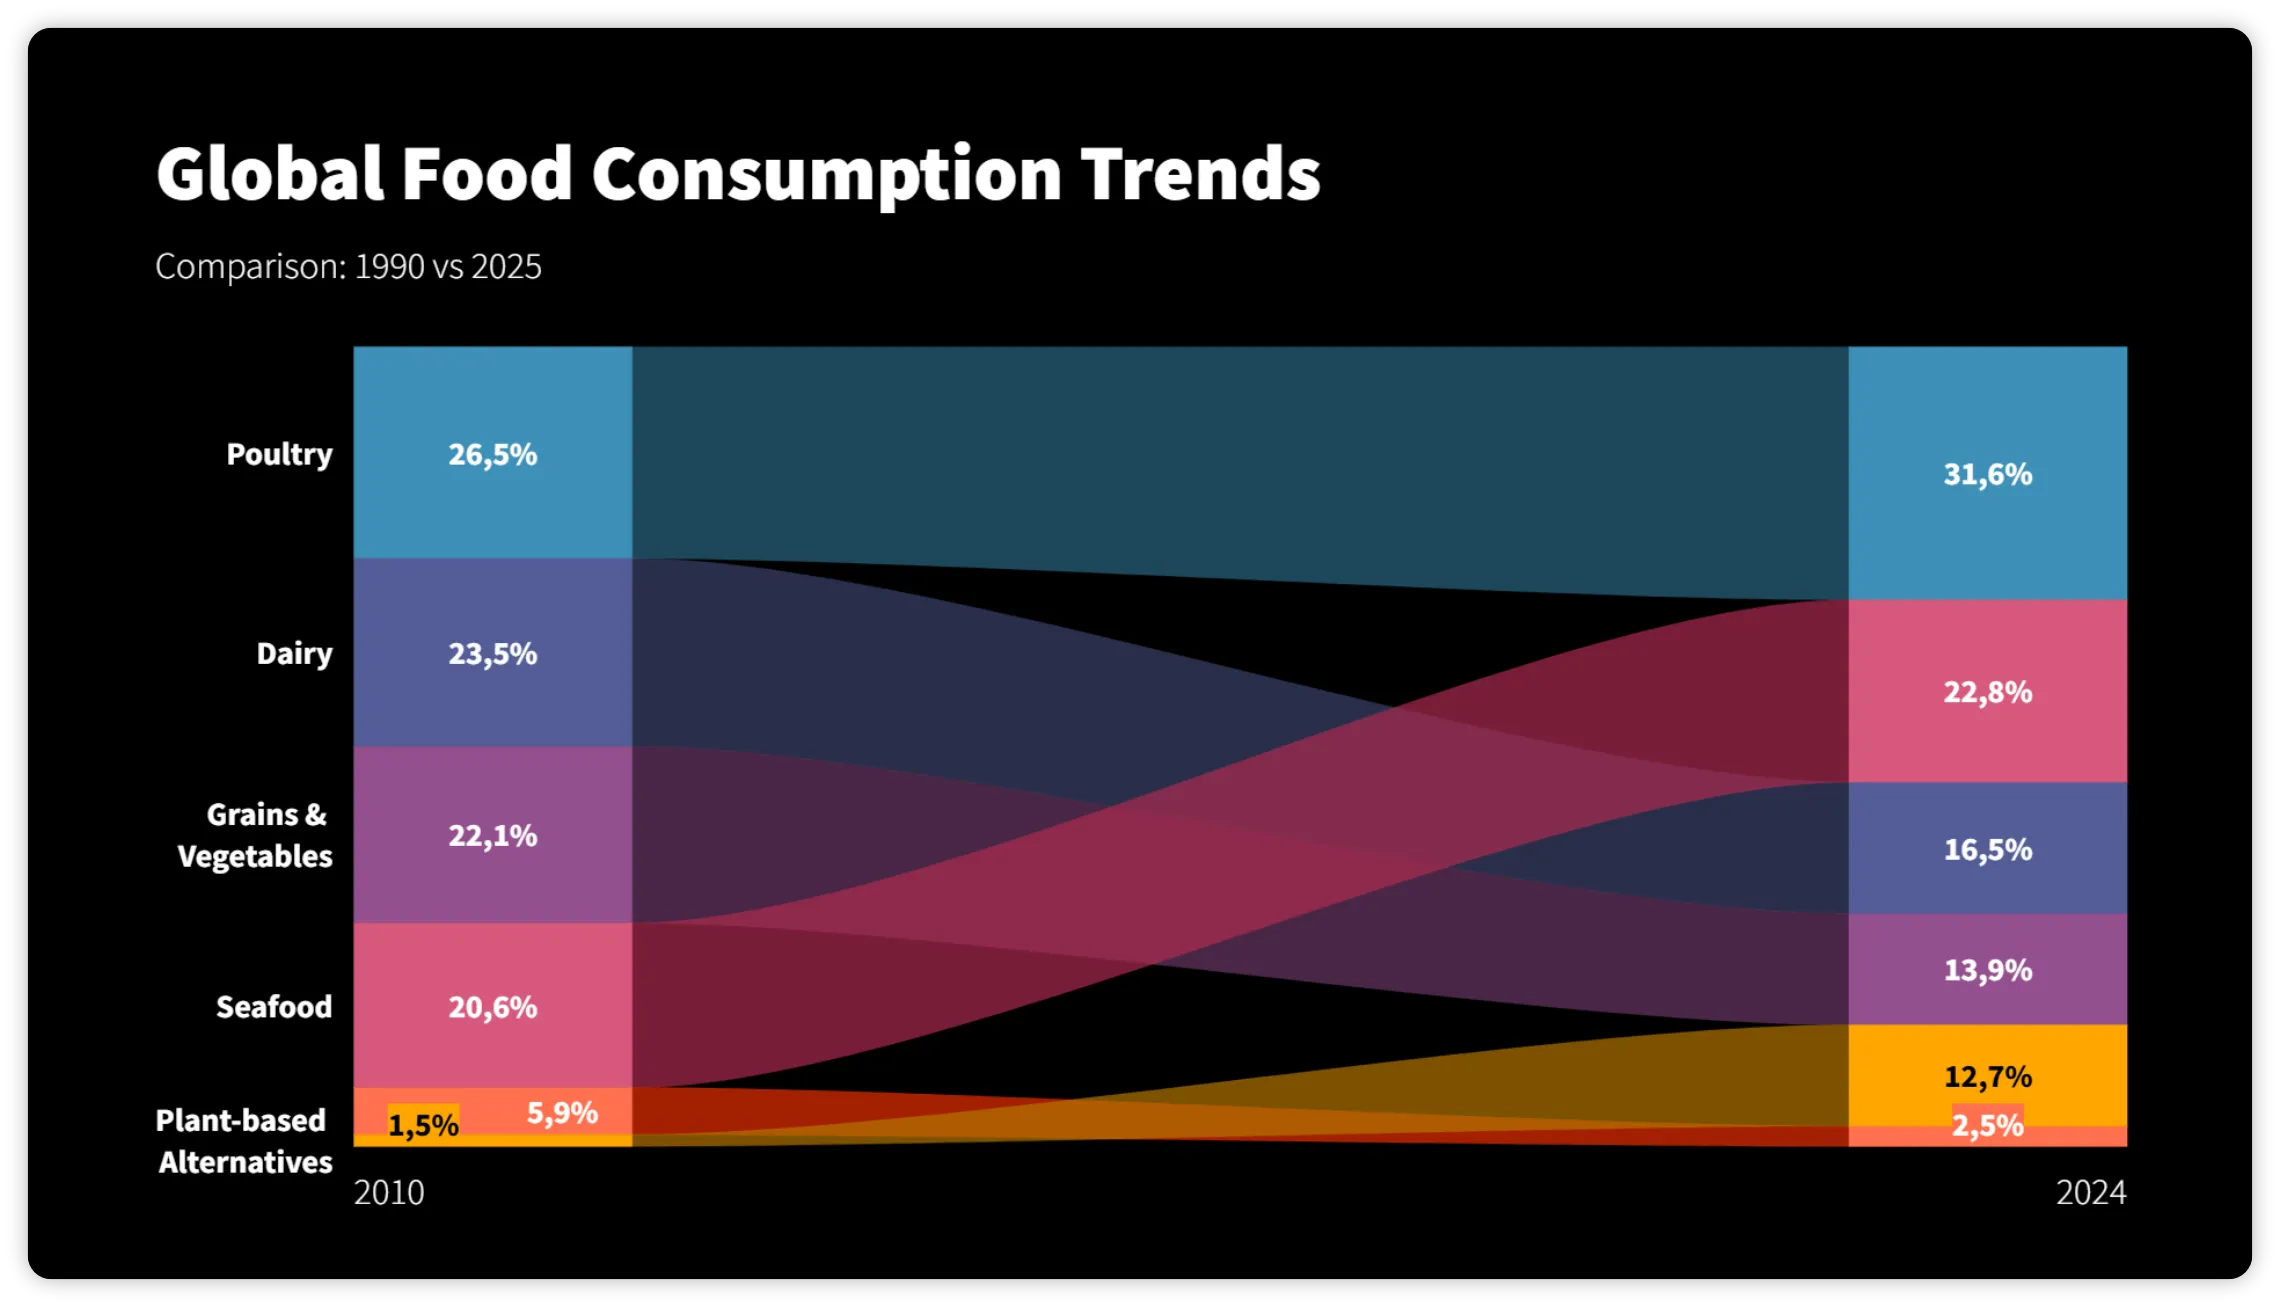
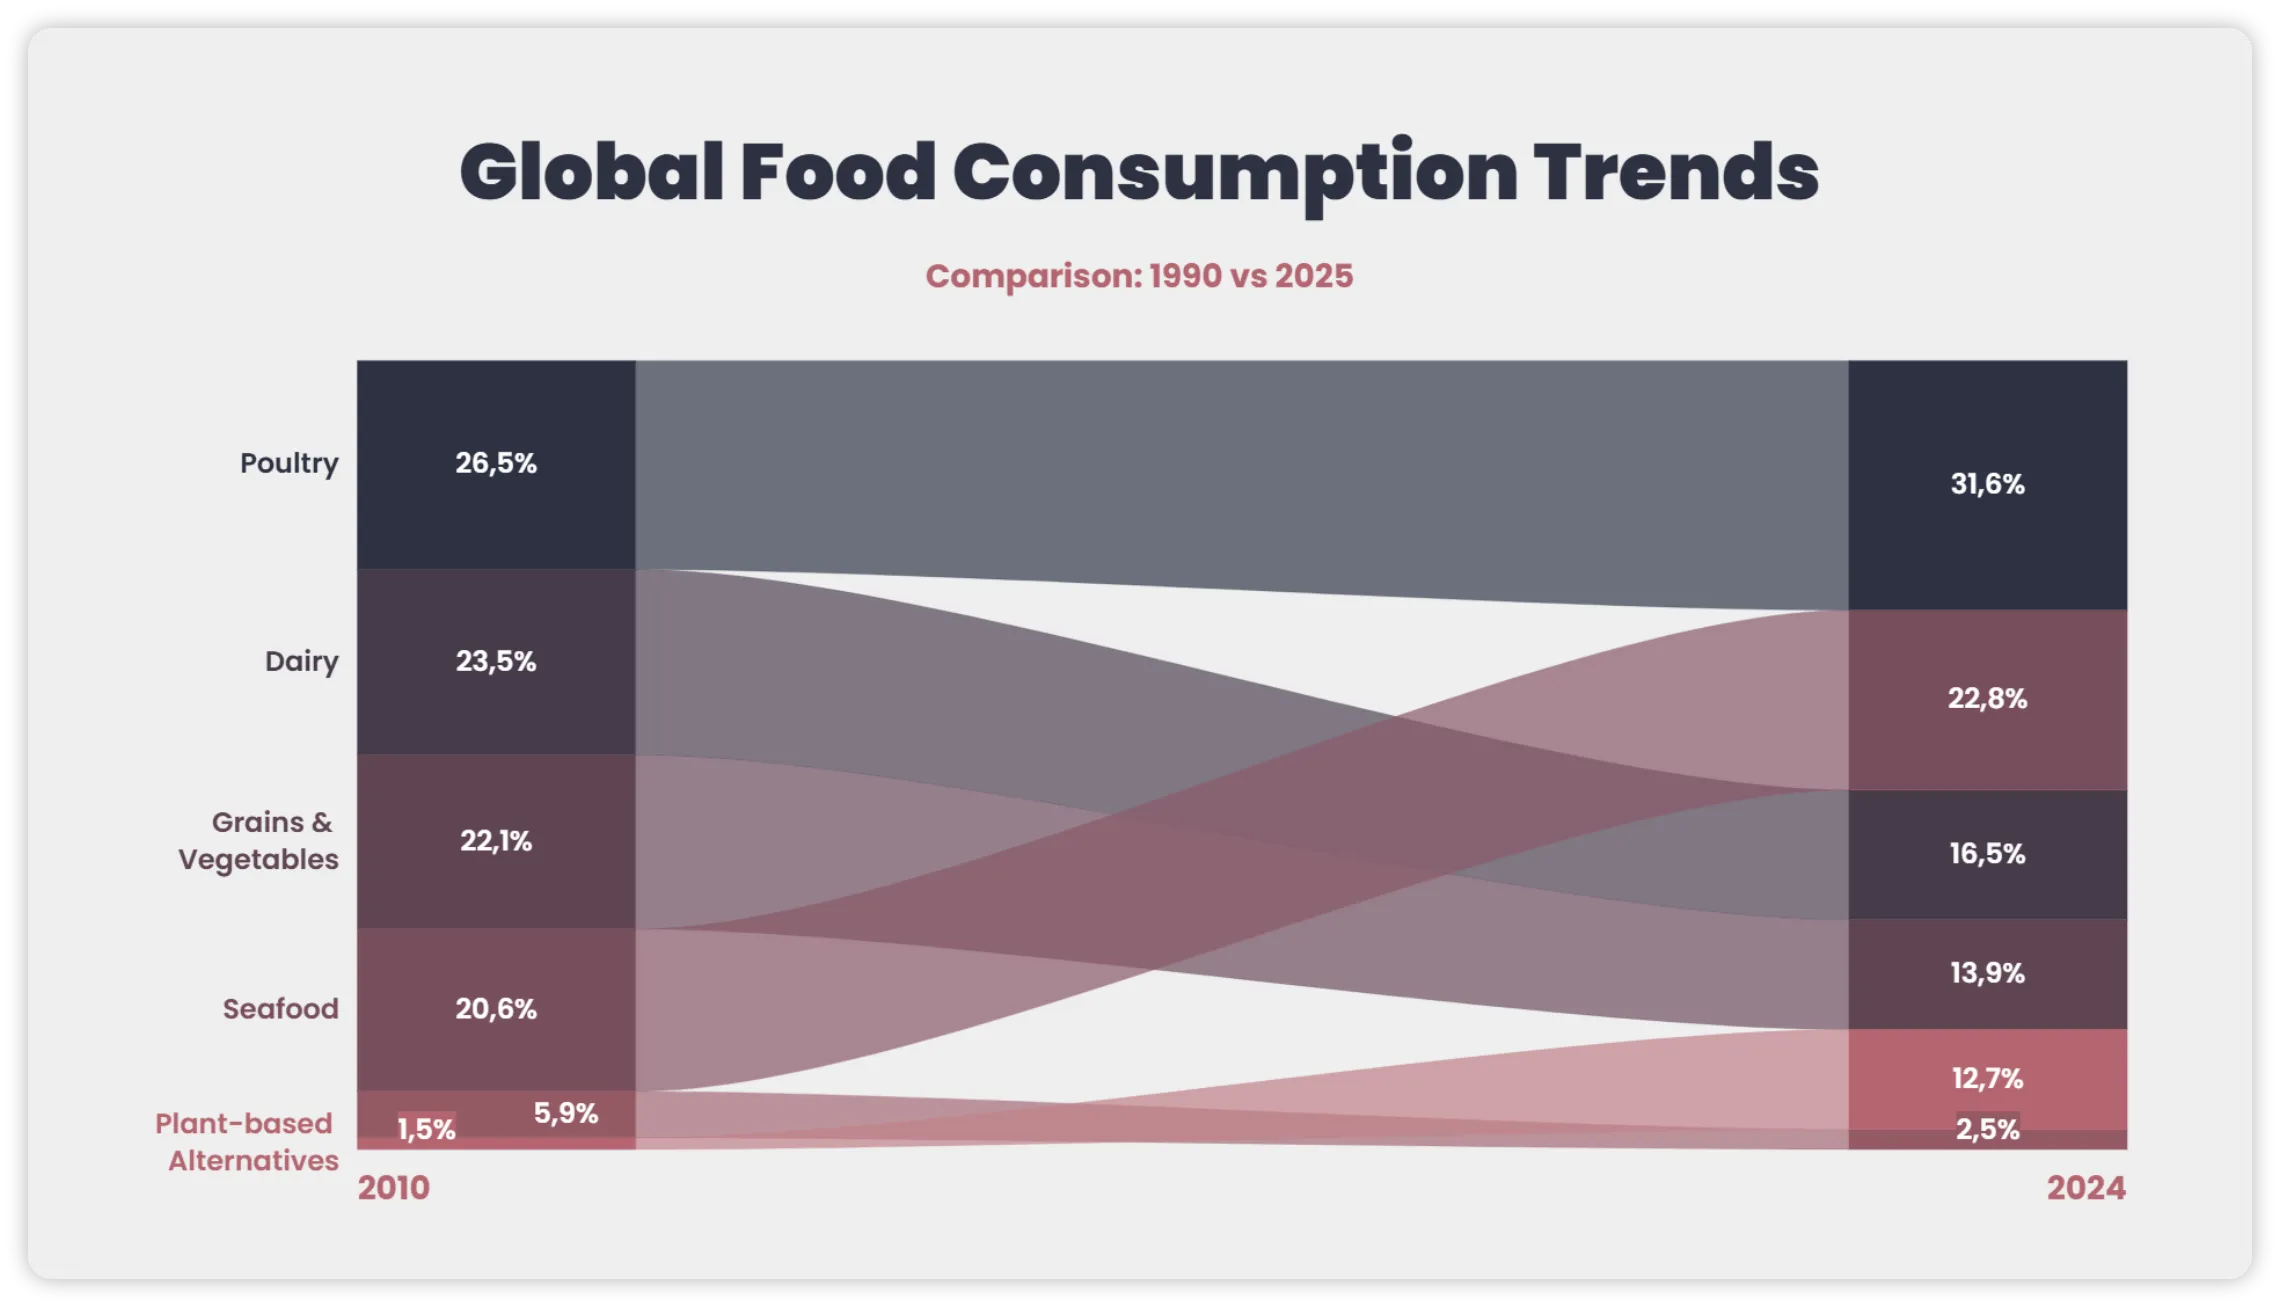
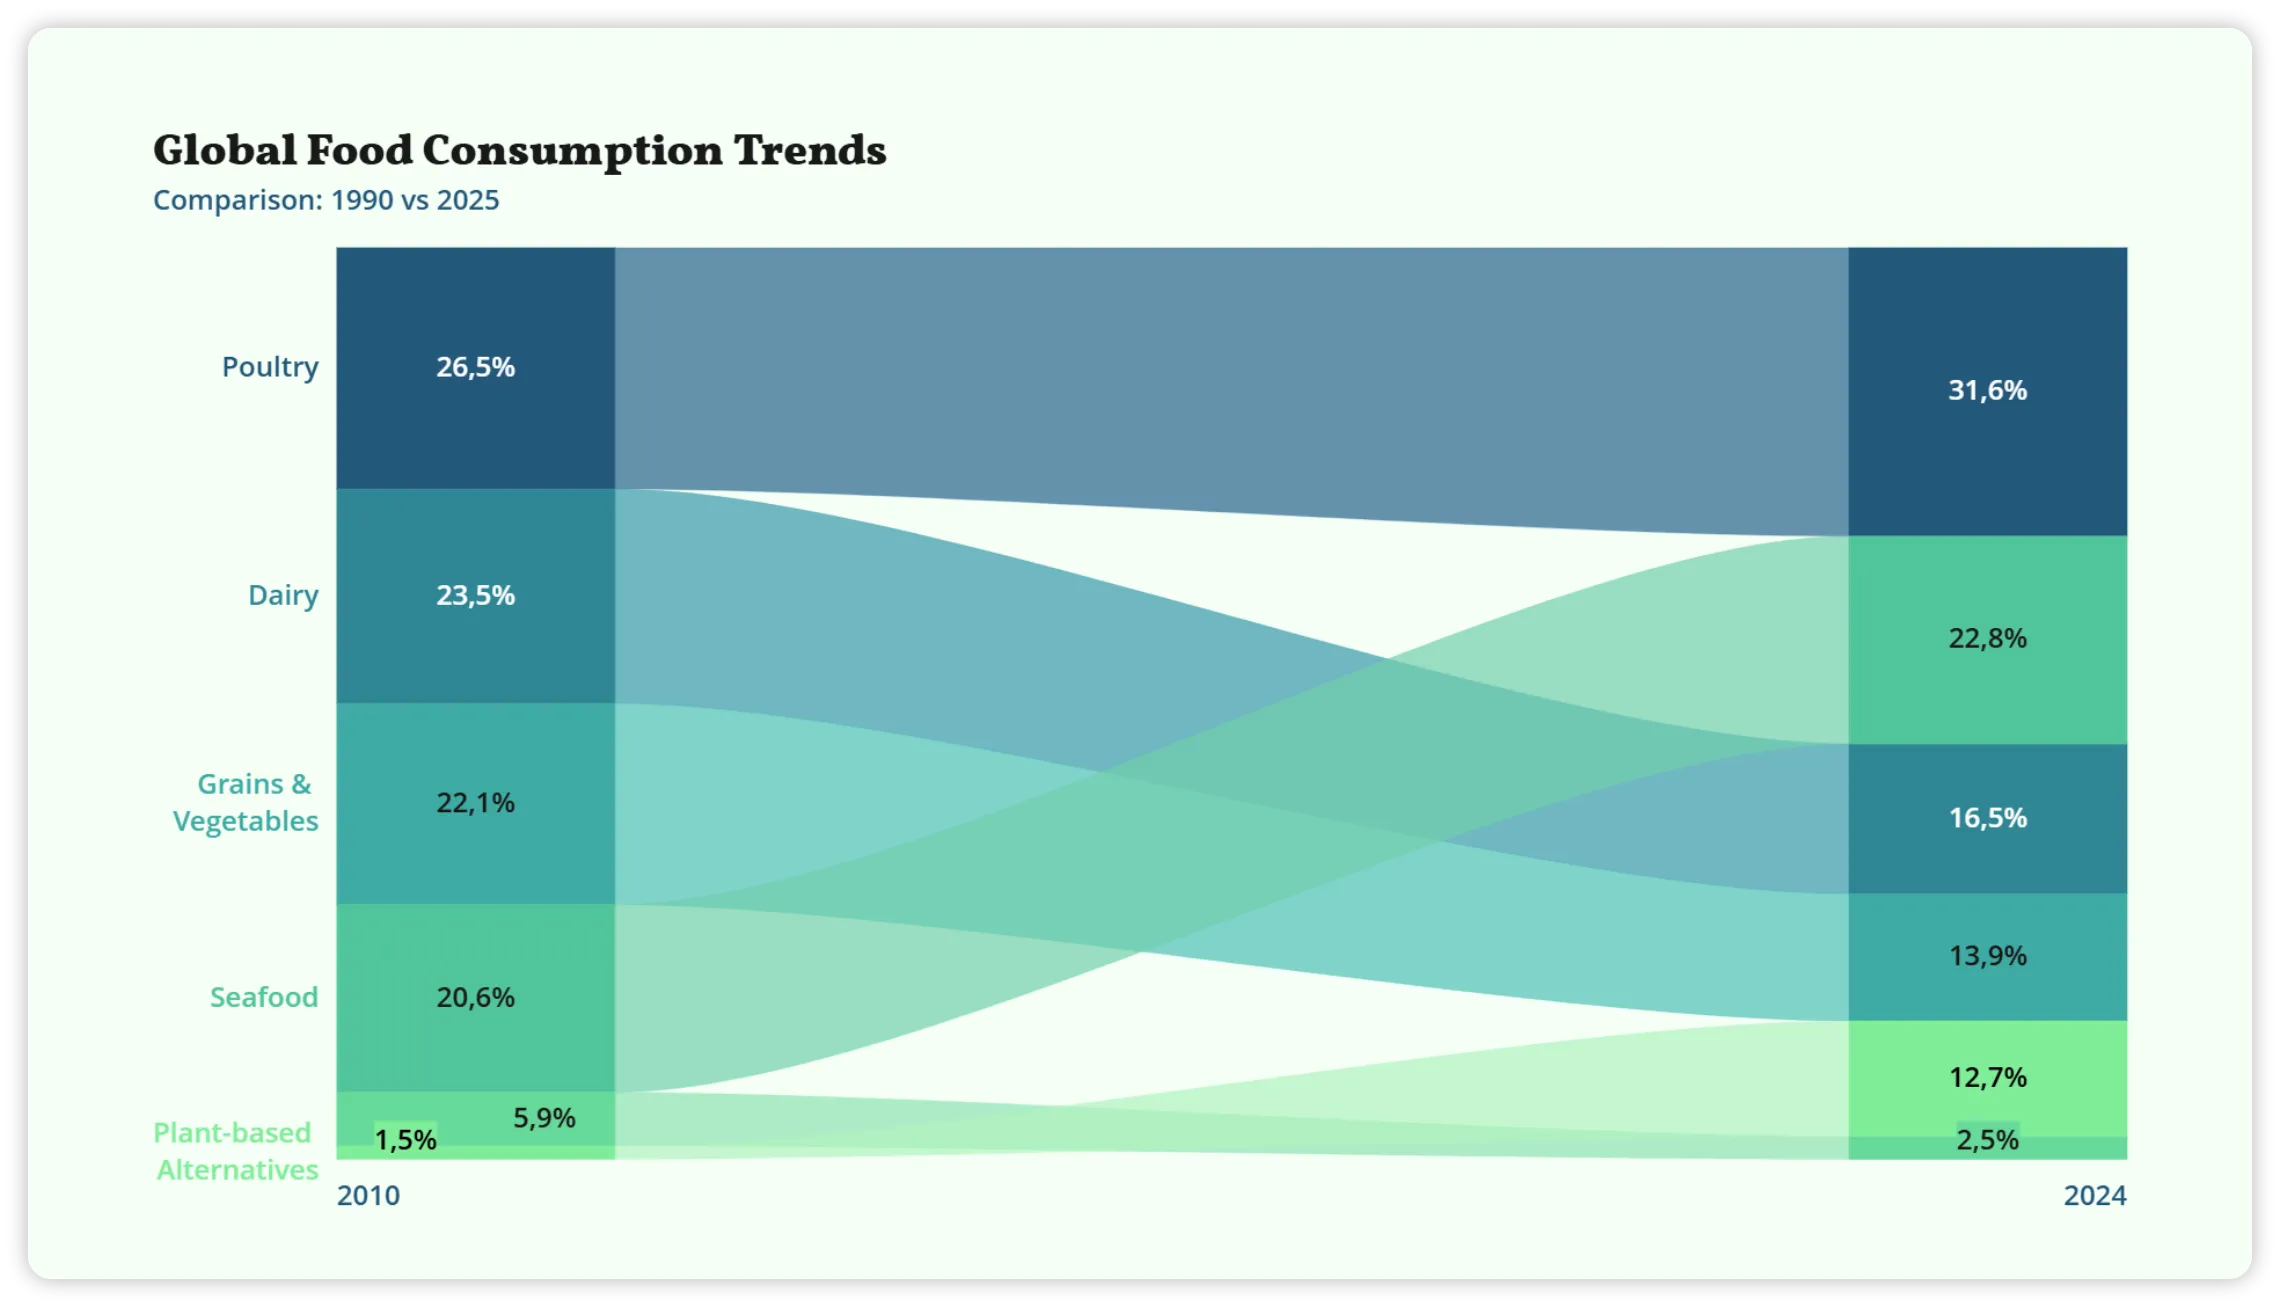
Keep every chart on brand
Create consistent visuals across reports, campaign decks, launch presentations and executive updates.
- Shared themes
- Brand colors & fonts
- Reusable templates


