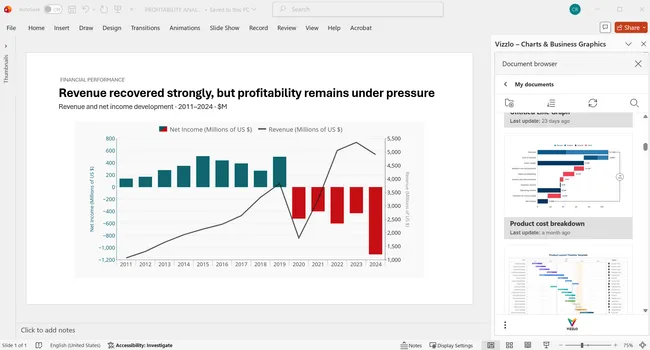







Less formatting.
Clearer financial reporting.
Finance teams work with constantly changing numbers. Vizzlo turns financial data into clear, professional charts faster.
-
 Build reports faster
-
 Explain performance clearly
-
 Keep reporting consistent
From financial data to management-ready reporting
-
Start with your data
Paste your data or import it from your workflow.
-
Choose the right chart
Show actuals, budgets, forecasts and KPIs with the right chart.
-
Explain the variance
Highlight what changed and the key drivers behind it.
-
Report with clarity
Export your chart or add it directly to your presentation.
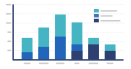
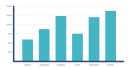
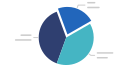
The right charts for financial reporting
Choose from 120+ chart types for reporting, forecasting, and performance analysis
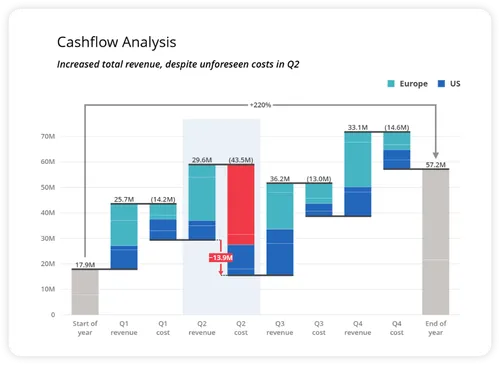
Make every variance easier to explain
Make it easier to explain what changed, why it changed, and what matters most.
- Show the bridge
- Highlight the biggest drivers
- Add context
- Update faster
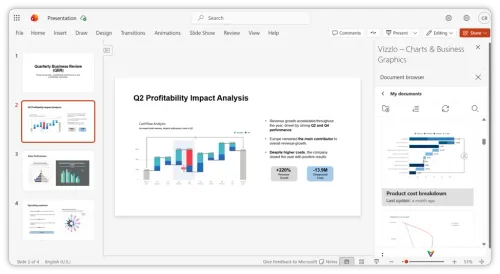
Built for the way finance teams already report
Create and edit financial charts in PowerPoint, Google Slides or your browser — or export them wherever you need.


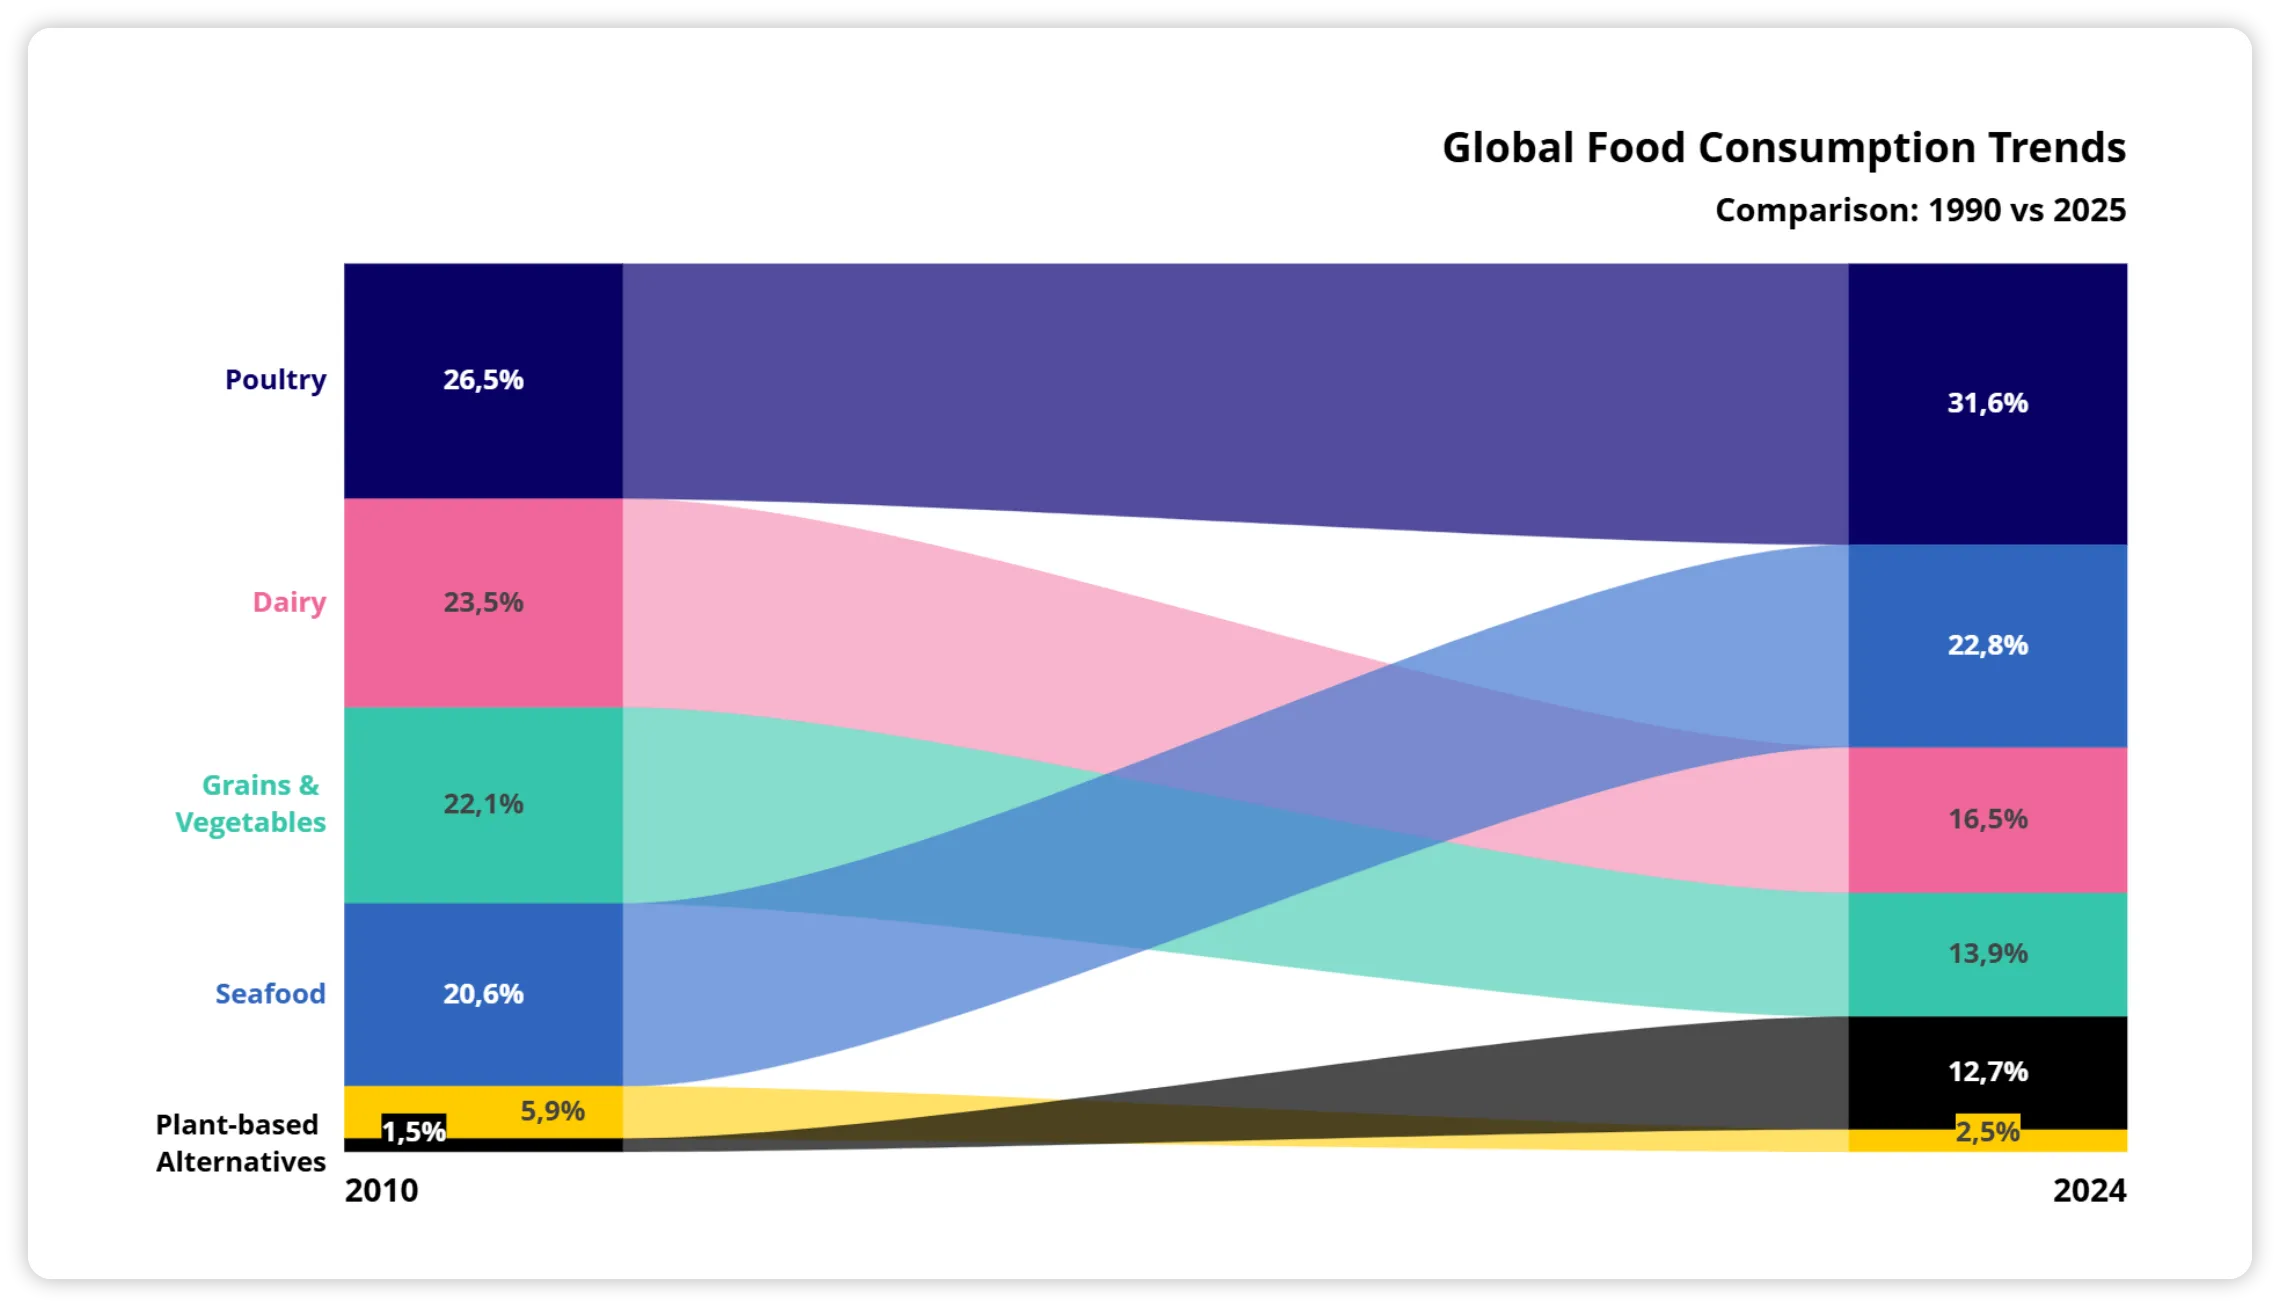
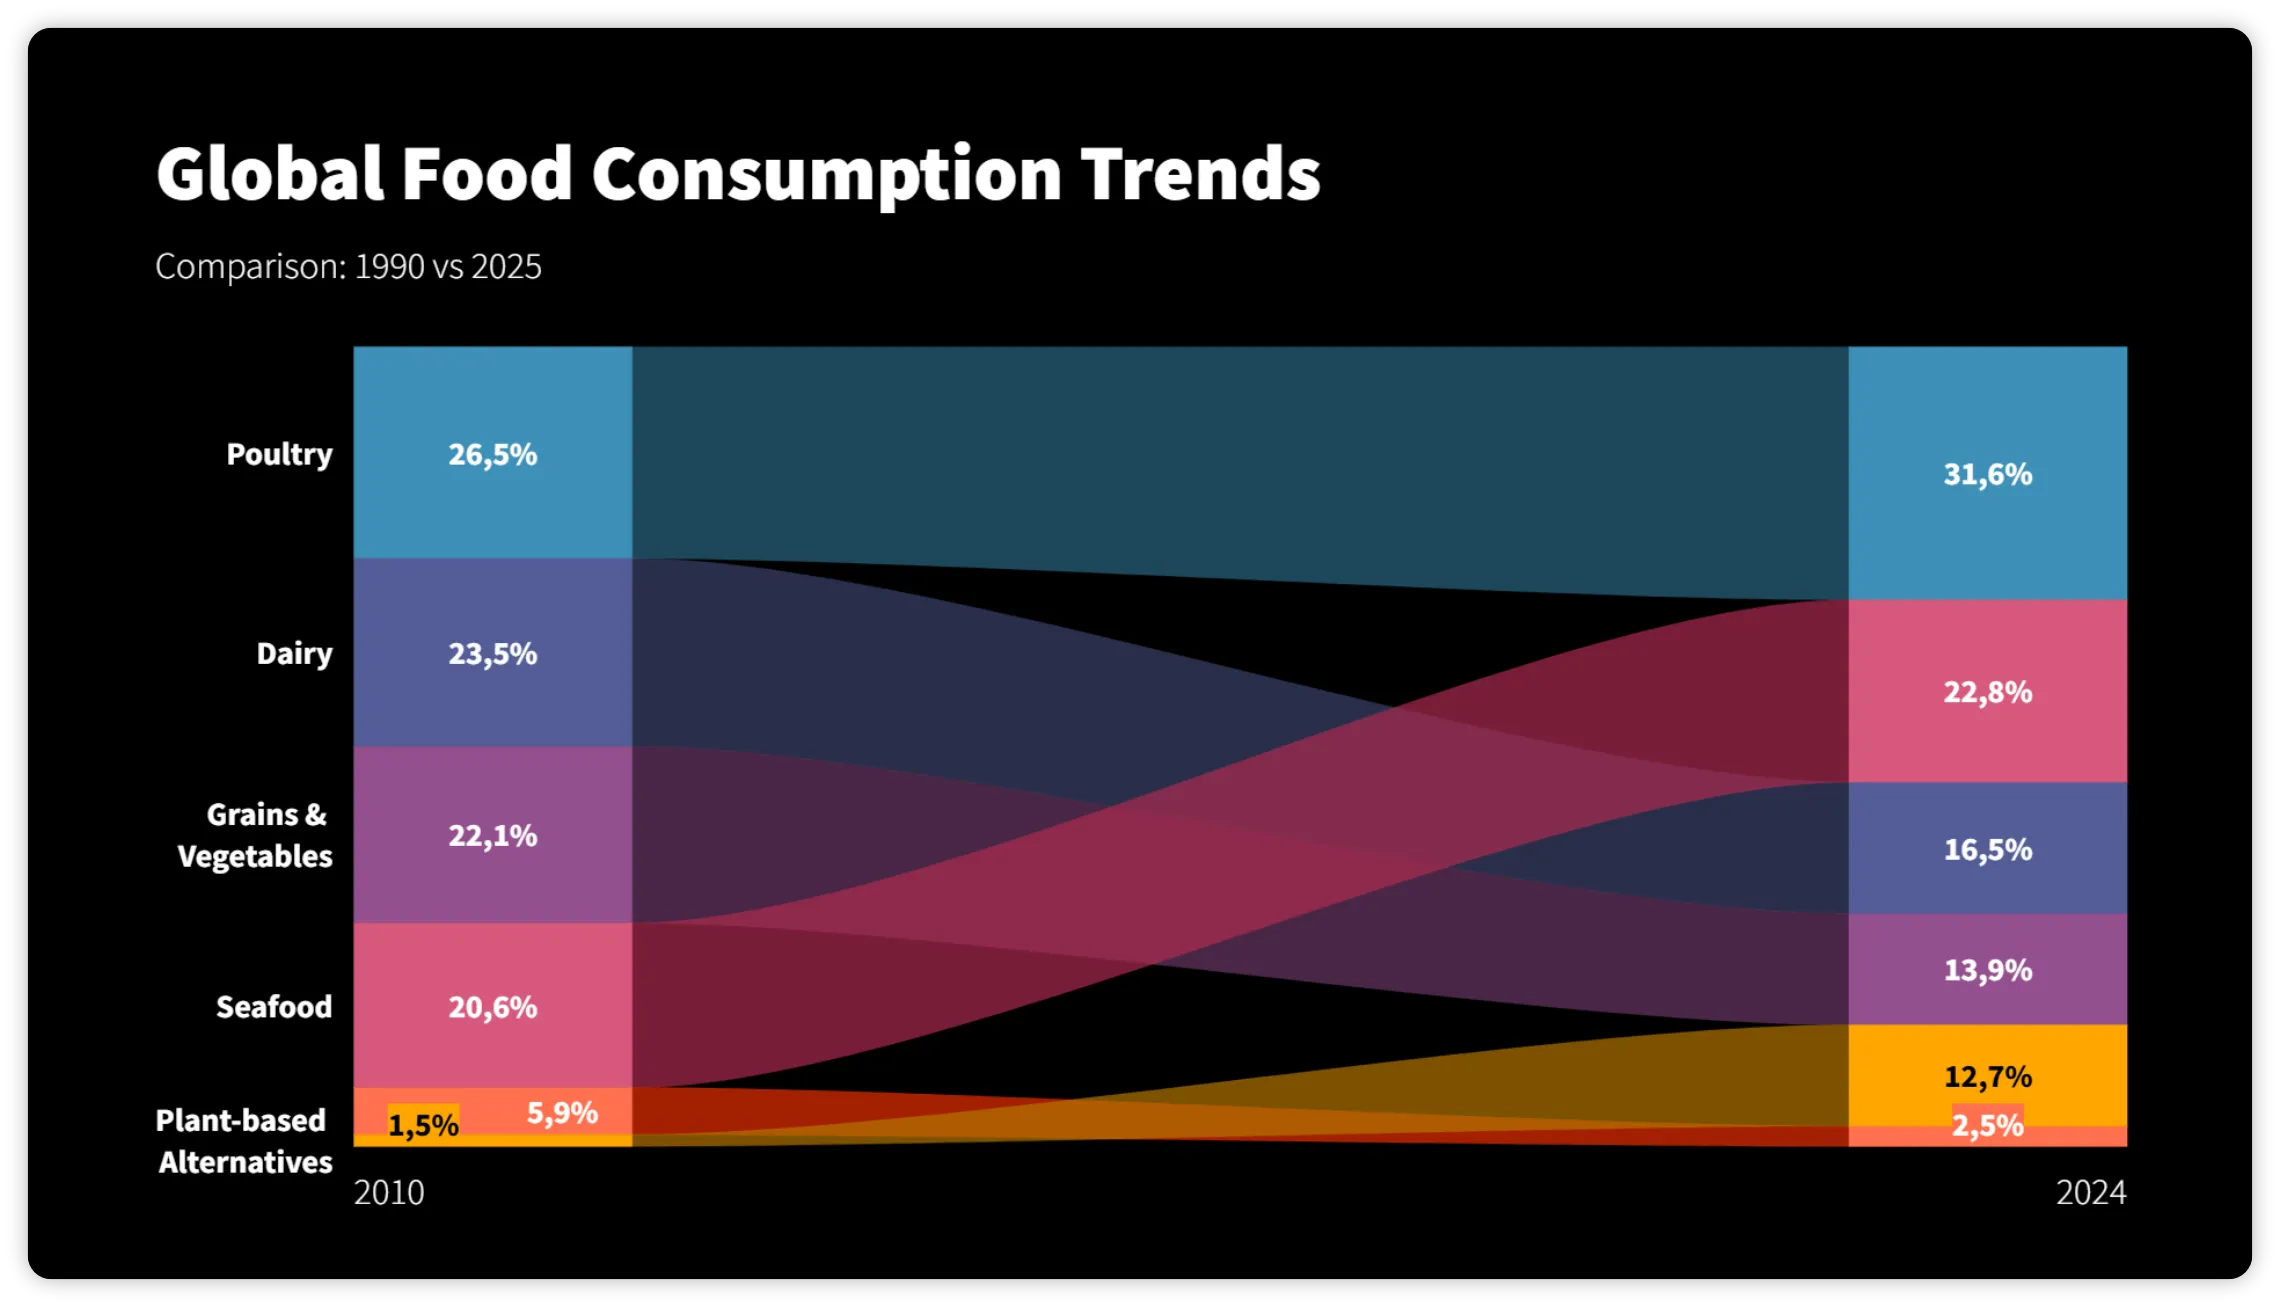
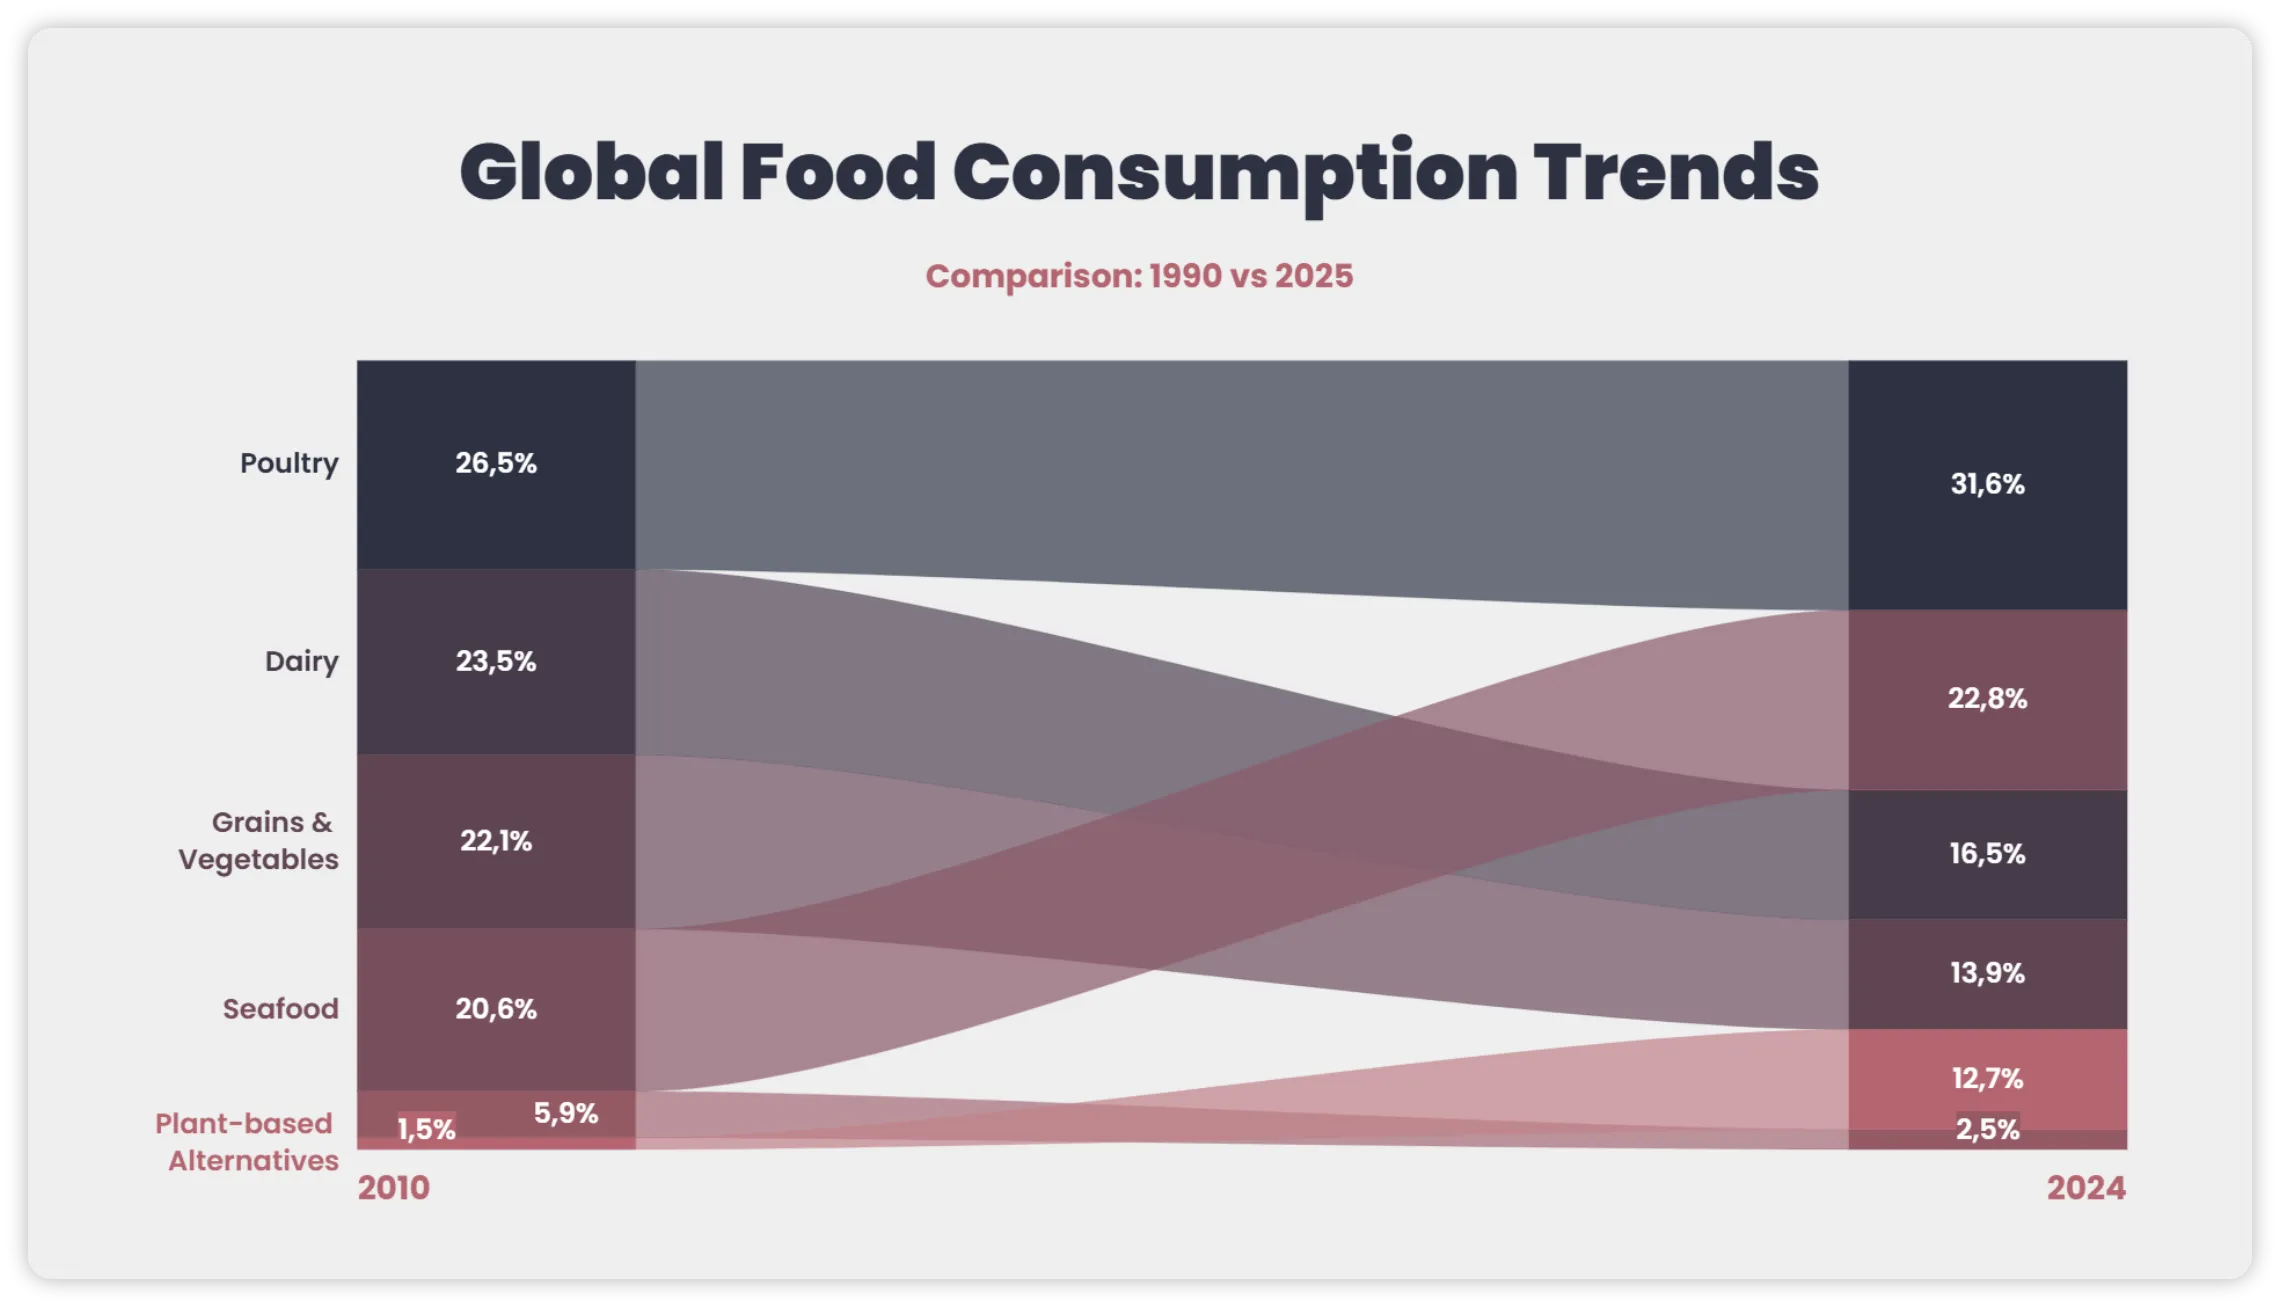
Standardize reporting across your organization
Keep charts, branding and access consistent while managing teams from one place.
- Shared themes
- Brand colors & fonts
- Reusable templates


