





Clearer plans.
Better project communication.
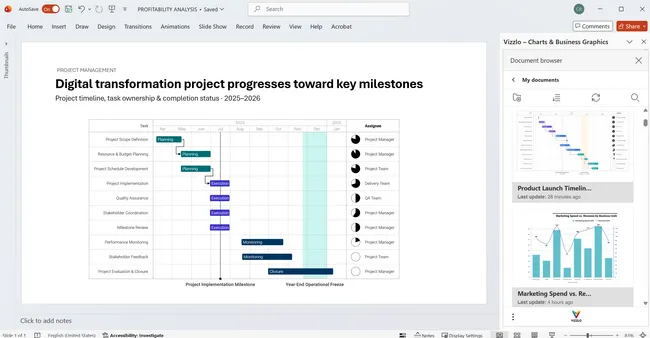
Turn project plans, timelines, and progress updates into clear, professional visuals that keep everyone aligned.
-
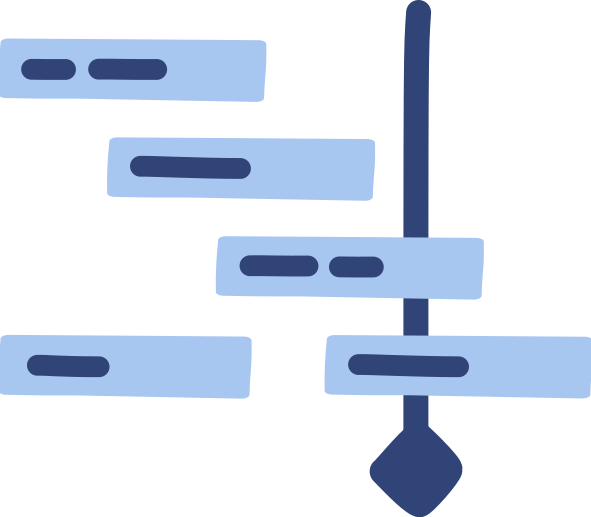 Visualize project plans
-
 Communicate progress
-
 Keep teams aligned
From project data to stakeholder-ready visuals
-
Start with your data
Add project tasks, timelines, milestones, or progress data.
-
Choose the right chart
Visualize schedules, project progress, and priorities with the right chart.
-
Highlight what matters
Draw attention to key milestones, deadlines, and changes.
-
Present and share
Use your charts in presentations or share them with your team.
The right charts for every project
Choose from 120+ chart types to visualize project timelines, milestones, resources, and performance.
-
Timeline
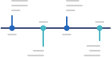 Milestones & deadlines
-
Stacked bar chart
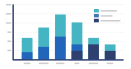 Resource allocation
-
Bubble chart
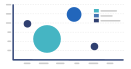 Risk prioritization
-
Gantt
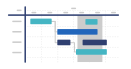 Project scheduling
-
Bar charts
 Progress comparison
-
Waterfall
 Budget tracking
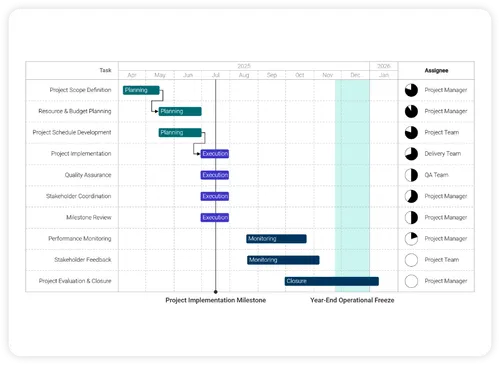
Keep every project on track
Turn complex schedules into clear visual timelines, so teams and stakeholders know what needs to happen and when.
- Plan the timeline
- Highlight milestones
- Align your team
- Update the plan
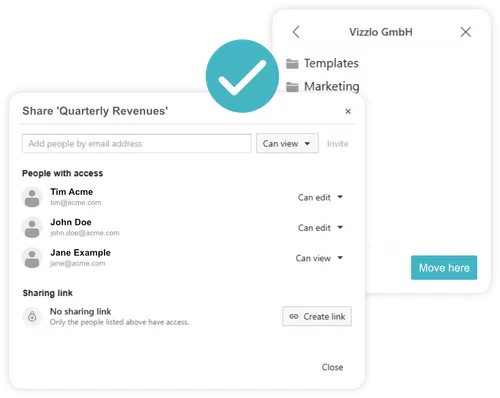
Keep your project team on the same page
Share project visuals, collaborate with teammates, and manage access — so everyone stays aligned as plans evolve.
- Share project charts
- Collaborate easily
- Control access
- Avoid version chaos
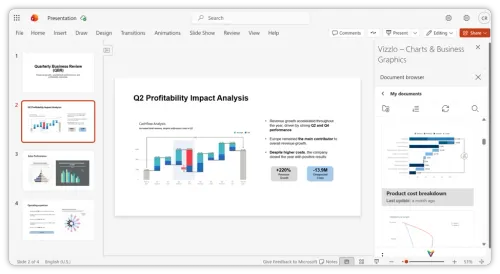
Built for the way project managers already present
Create and edit project timelines, Gantt charts, and progress visuals directly in PowerPoint, Google Slides, or your browser.


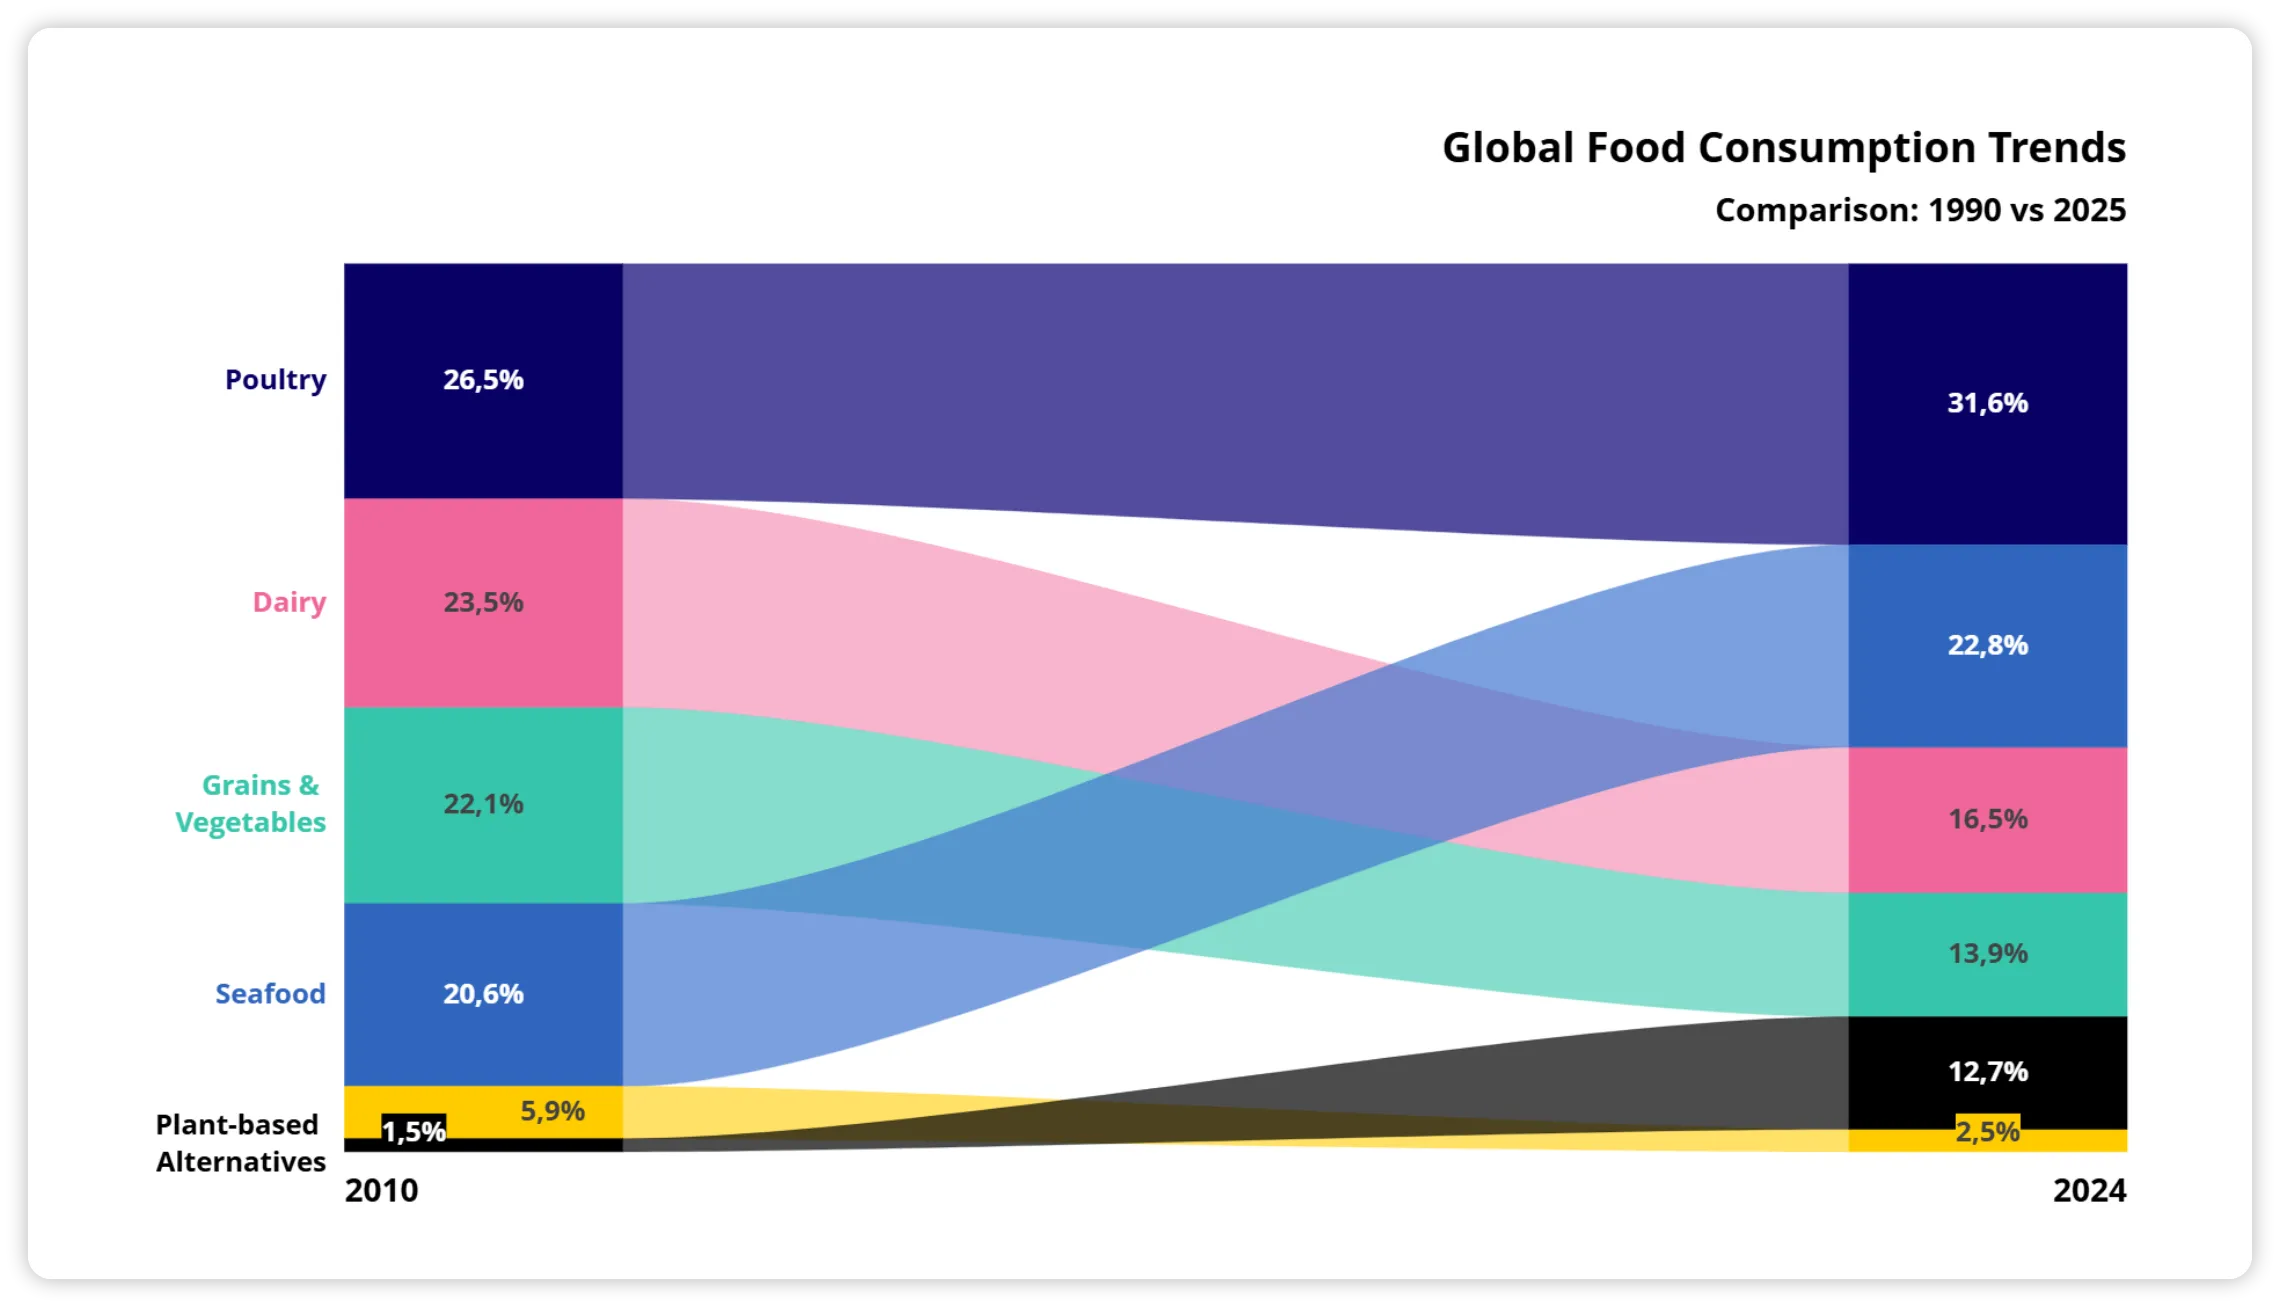
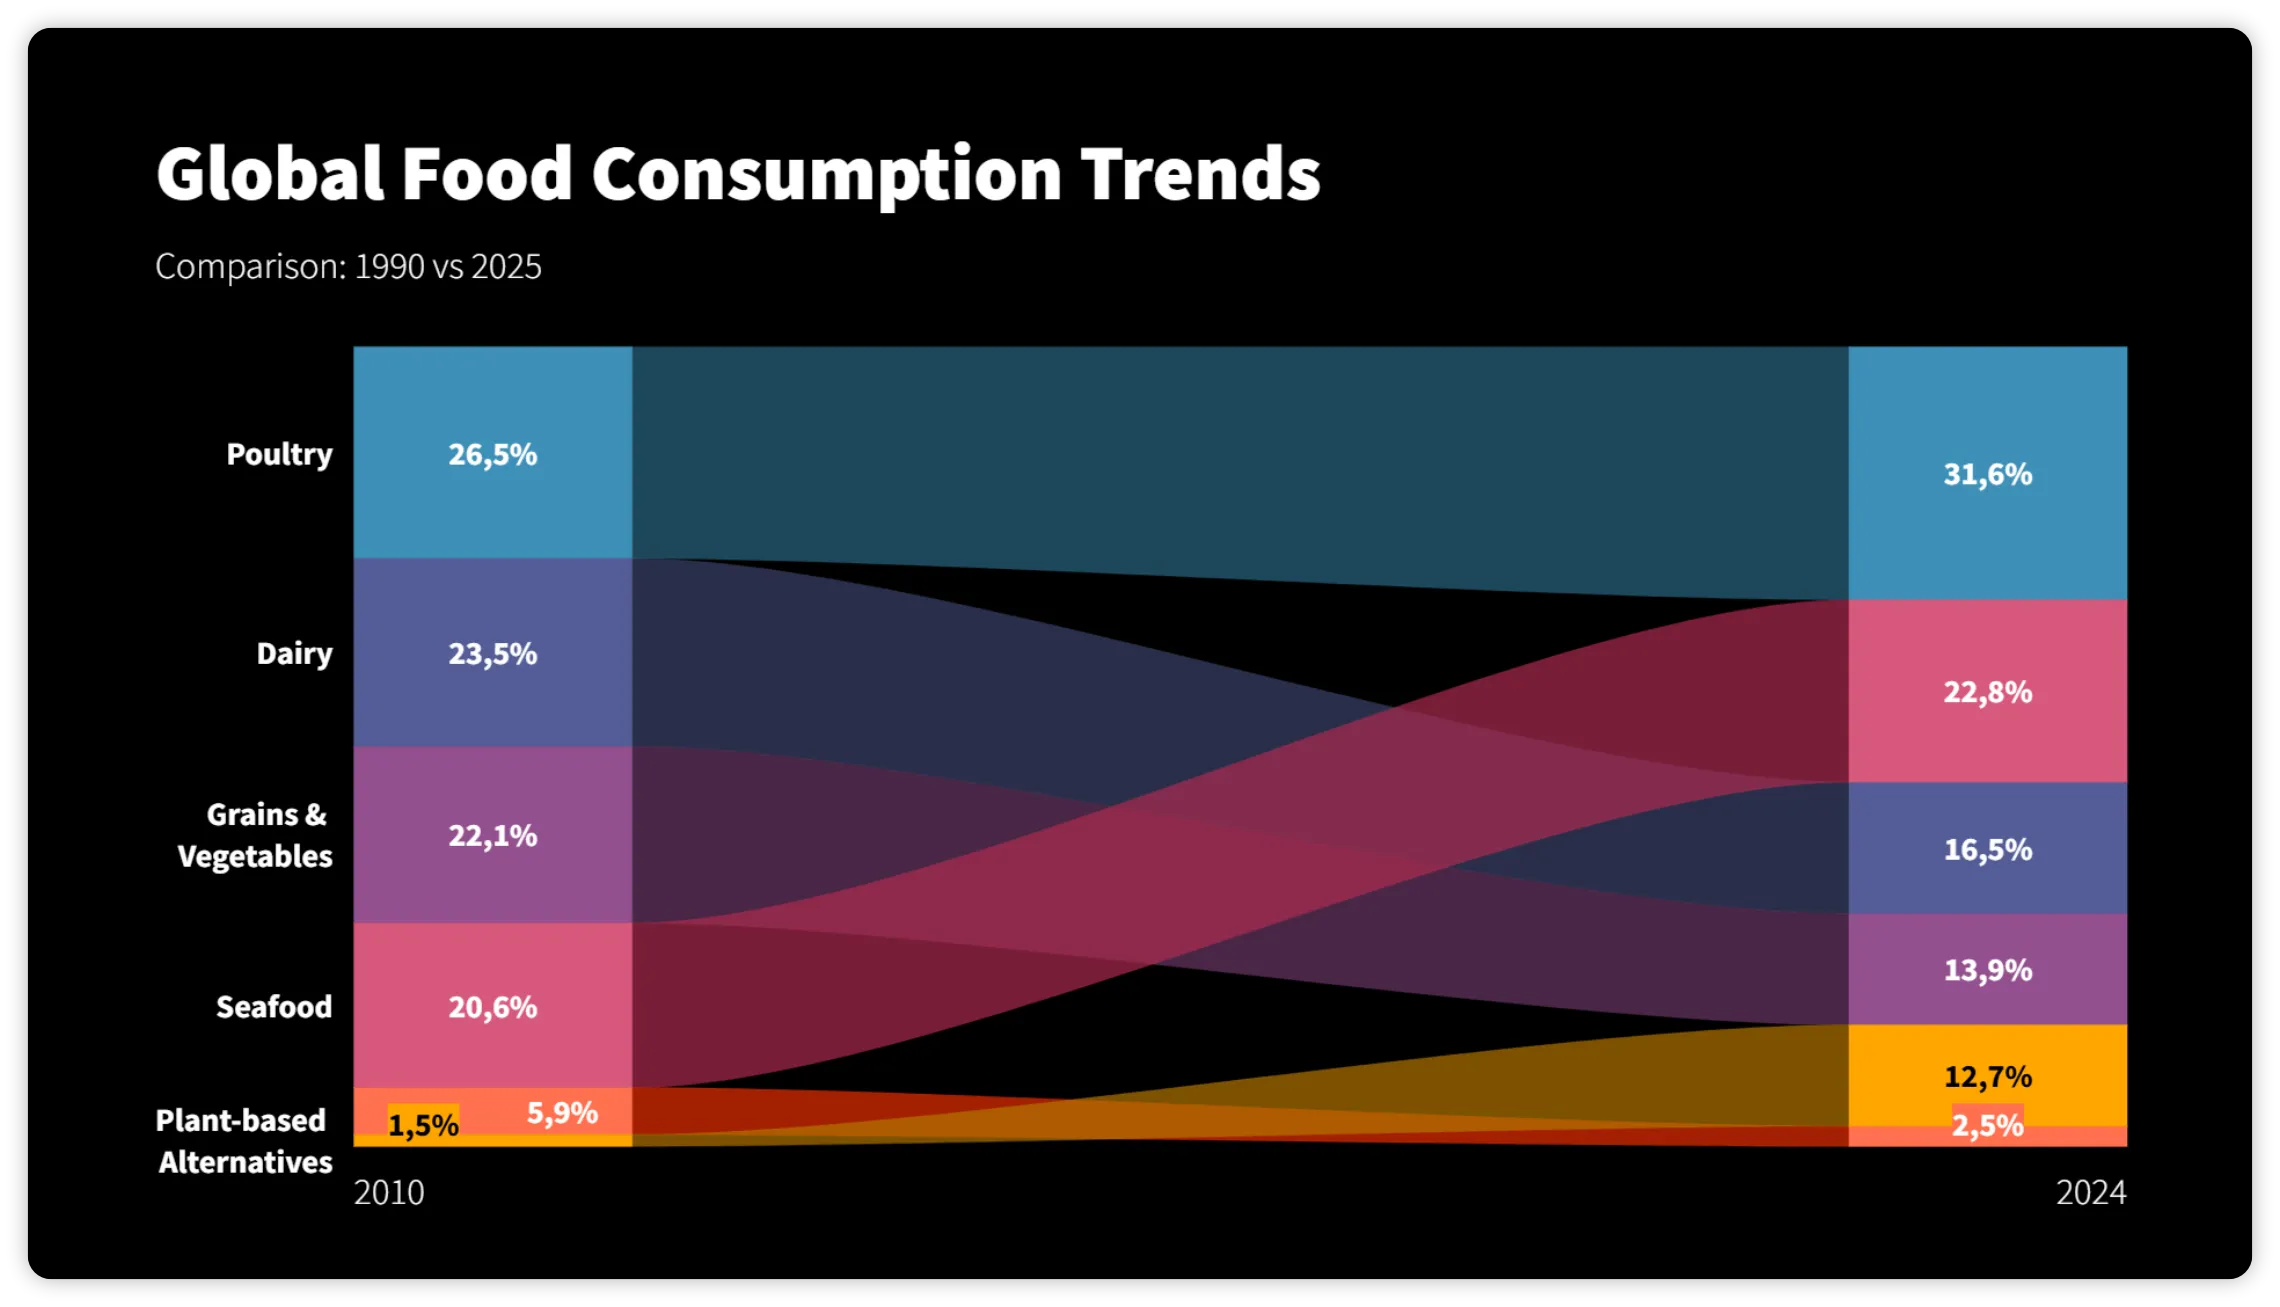
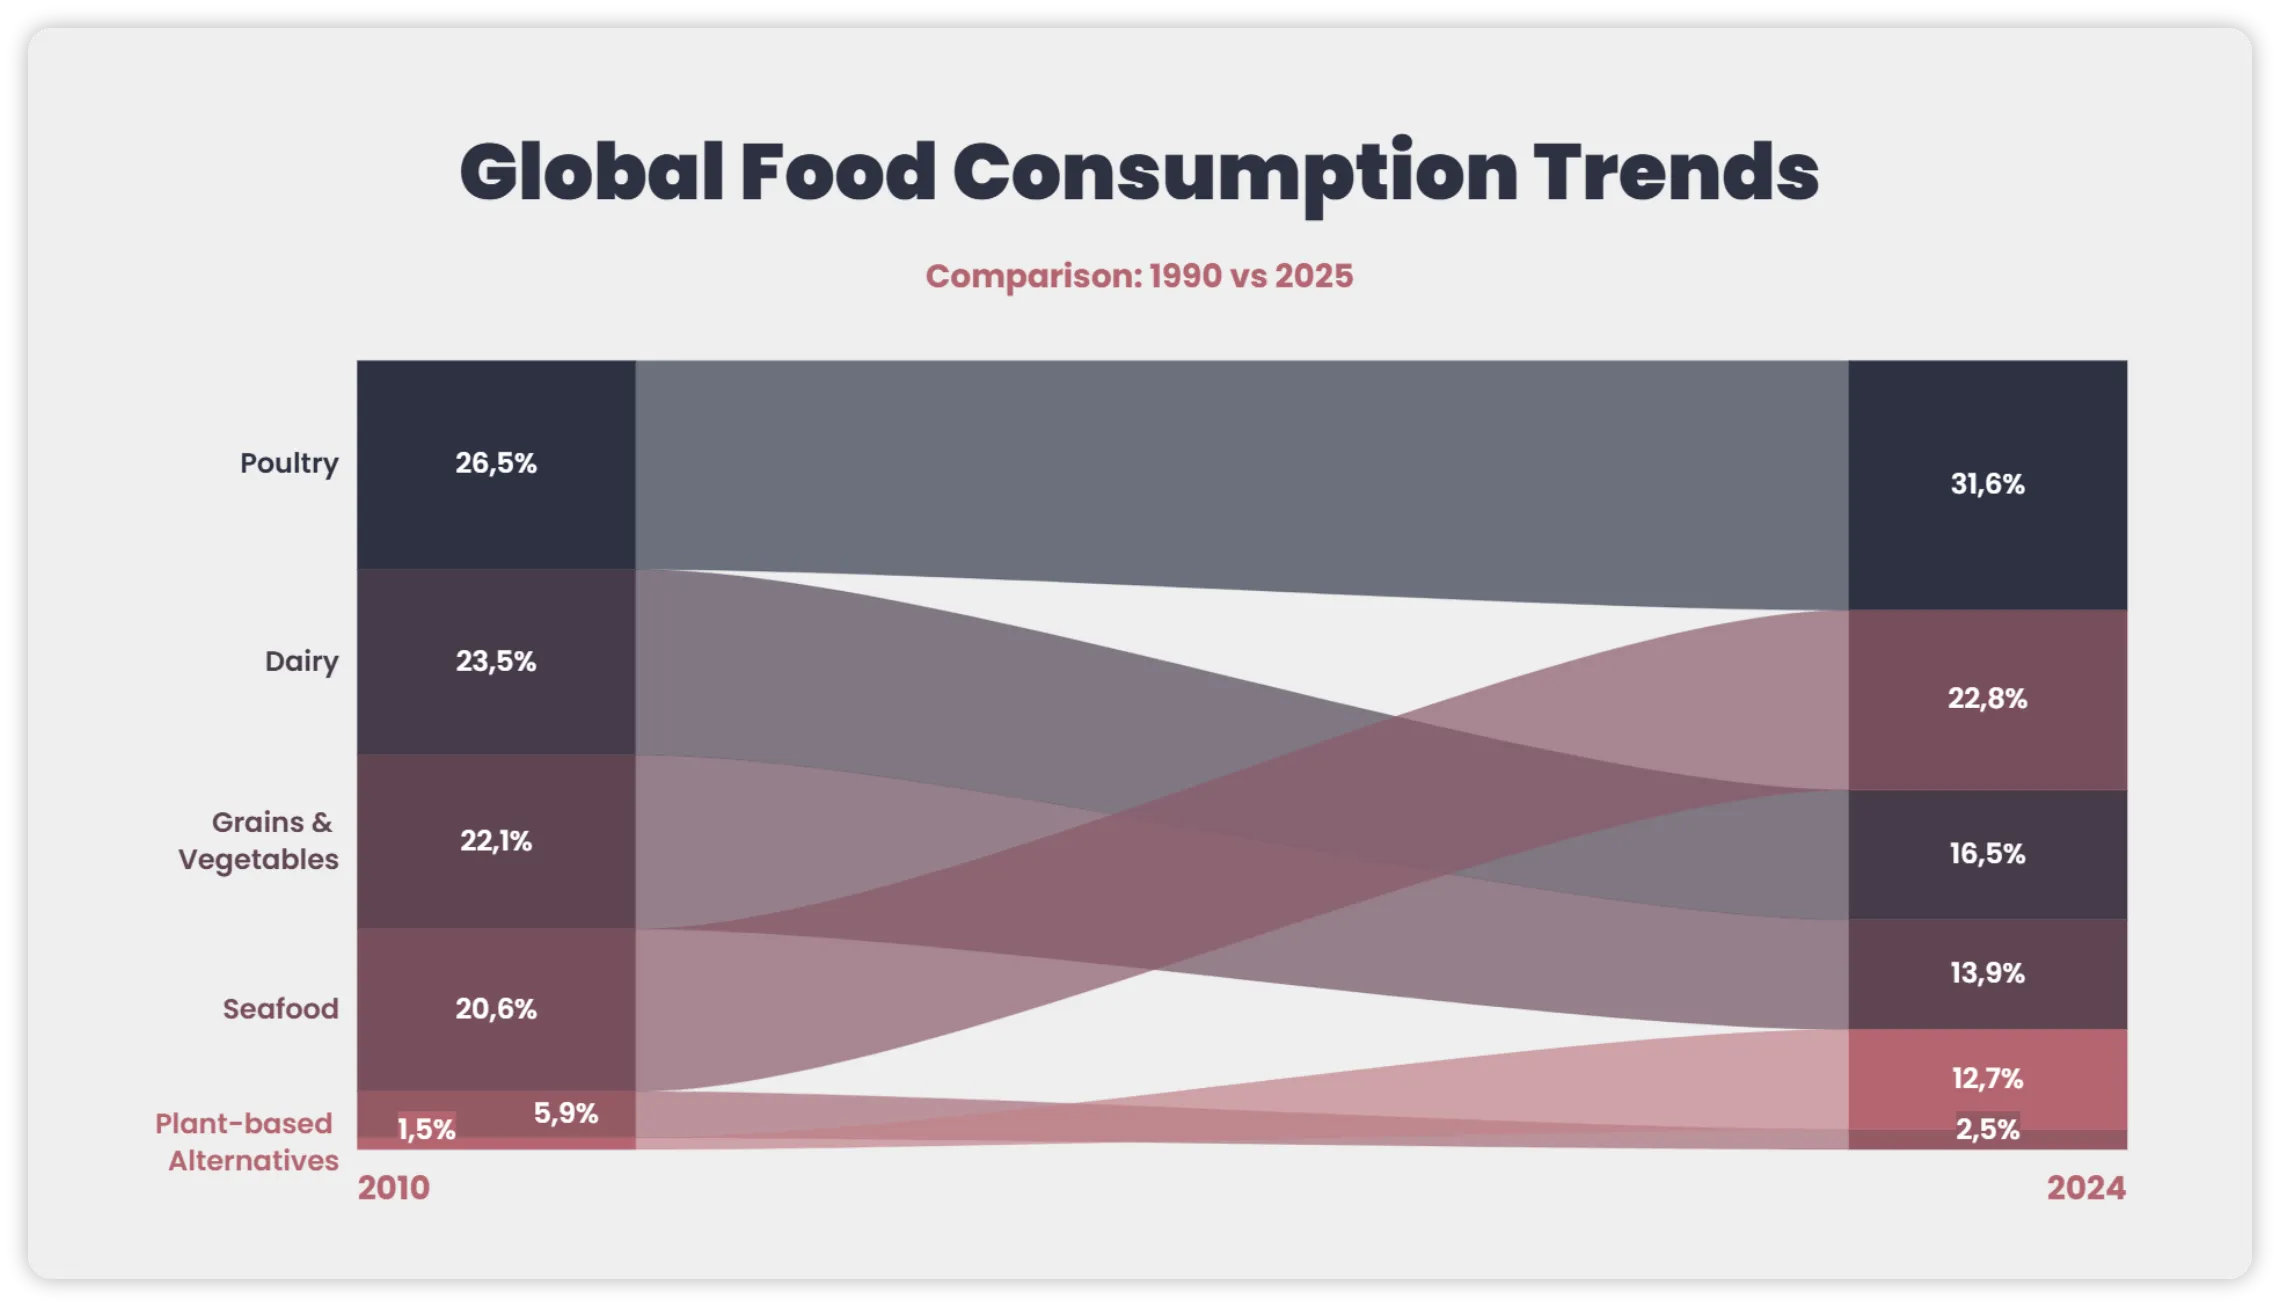
Consistent reporting across every project
Keep project charts, presentations, and visual standards consistent across teams — from individual project updates to executive reporting
- Shared themes
- Brand colors & fonts
- Reusable templates


