Chart Vizzard
Vizzlo's AI-based chart generatorVertical Funnel Chart
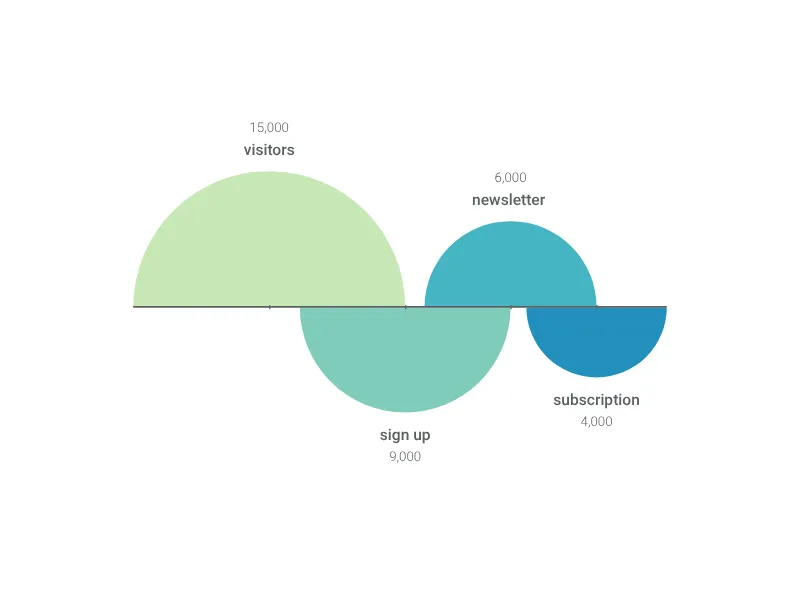
Create a beautiful funnel chart with up to six stages to map out your sales pipeline or any other process.
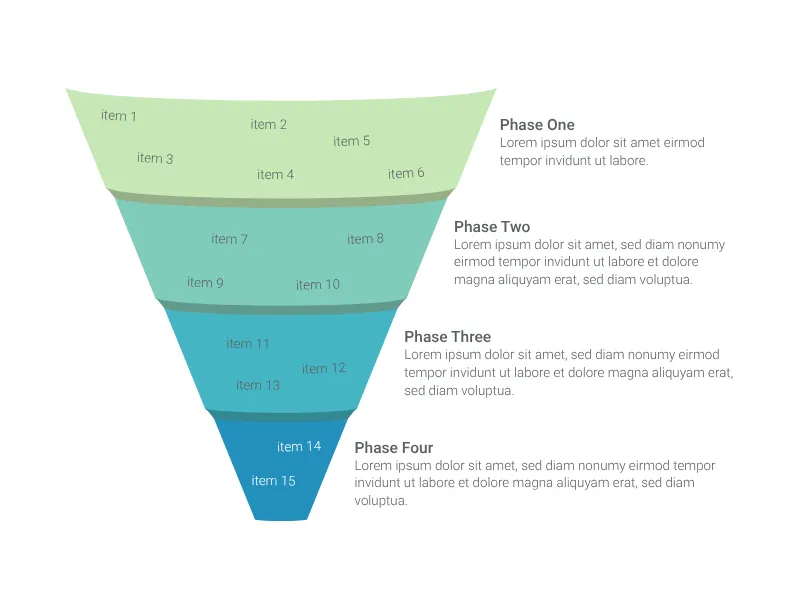
What is a vertical funnel chart?
The Vertical Funnel Chart creates a sophisticated visualization of multi-stage processes, sales pipelines, or any workflow where items progress through sequential phases with natural attrition. This elegant funnel design clearly shows how quantities decrease through each stage, making it perfect for analyzing conversion rates, process efficiency, and pipeline management.
Key Features
- Multi-stage visualization: Up to 6 customizable stages for complex process mapping
- Item positioning: Precise placement of individual items within each funnel stage
- Stage customization: Individual titles, descriptions, values, and colors for each phase
- Flexible sizing: Choose proportional stage heights or equal heights for all stages
- Value display: Optional stage value presentation with comprehensive formatting
- Item grouping: Optional grouping of items within stages for organized presentation
- Professional design: Clean, executive-ready appearance suitable for business presentations
Best Use Cases
- Sales pipeline management: Lead qualification, proposal, negotiation, and closing stages
- Recruitment processes: Application, screening, interview, and hiring phases
- Product development: Concept, design, prototype, testing, and launch stages
- Customer journey mapping: Awareness, consideration, purchase, and retention phases
- Quality control: Inspection, testing, approval, and delivery stages
- Marketing funnels: Traffic, leads, prospects, and customer conversion
- Project workflows: Planning, execution, review, and completion phases
Configuration Options
Customize your funnel with comprehensive controls:
- Stage proportions: Toggle between proportional heights based on values or equal heights
- Value display: Show or hide numerical values for each stage
- Item naming: Custom terminology for items (leads, candidates, products, etc.)
- Stage configuration: Individual setup for each funnel phase including colors and descriptions
- Item grouping: Optional organization of items within stages
Visual Design Philosophy
The funnel metaphor effectively communicates:
- Natural progression: Items flow logically from one stage to the next
- Conversion patterns: Visual representation of where and how much attrition occurs
- Process bottlenecks: Stages with disproportionate item accumulation become obvious
- Efficiency measurement: Easy identification of stages with high drop-off rates
Professional Applications
This visualization excels for:
- Pipeline analysis: Understanding where prospects are lost in sales processes
- Process optimization: Identifying bottlenecks and improvement opportunities
- Performance monitoring: Tracking conversion rates and stage efficiency
- Resource planning: Allocating support based on stage volumes and requirements
Strategic Advantages
The vertical funnel format provides:
- Executive clarity: Immediate understanding of process health and performance
- Conversion insights: Visual representation of where improvements are needed
- Capacity planning: Understanding of stage-specific resource requirements
- Performance benchmarking: Clear metrics for comparing process efficiency over time
Item Management
Individual item tracking allows for:
- Detailed pipeline visibility: Know exactly what’s in each stage
- Progress monitoring: Track specific items as they move through the process
- Bottleneck identification: See where items accumulate or get stuck
- Personalized management: Individual attention to high-value items
The Vertical Funnel Chart transforms complex multi-stage processes into clear, actionable visualizations that facilitate better process management, resource allocation, and strategic decision-making across various business functions.
Vertical Funnel Chart: What's new?
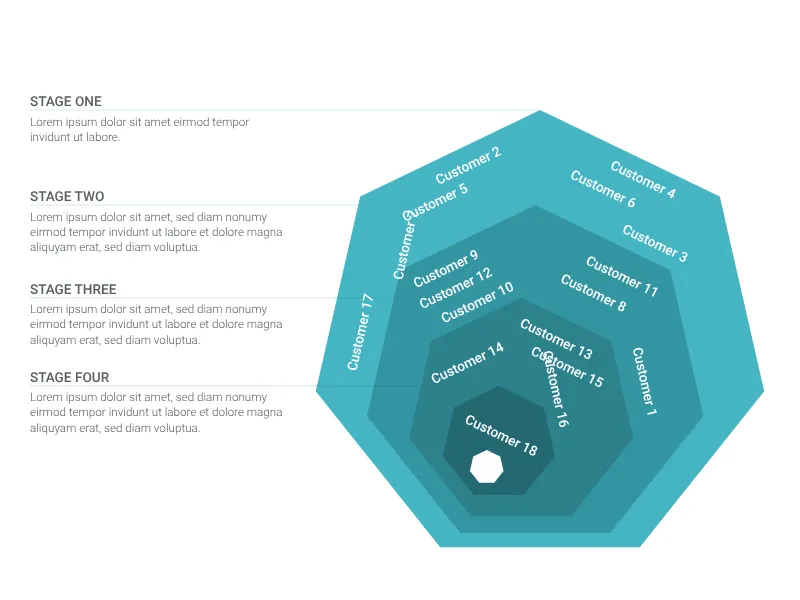
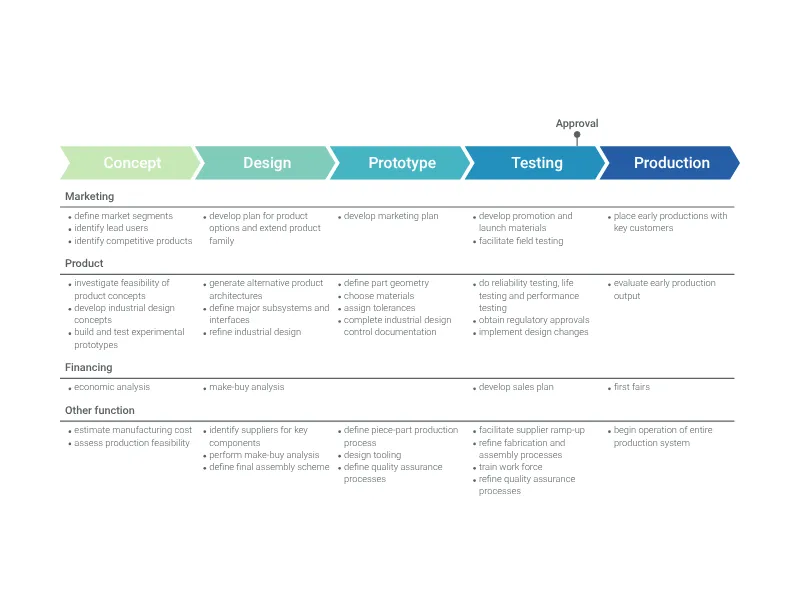
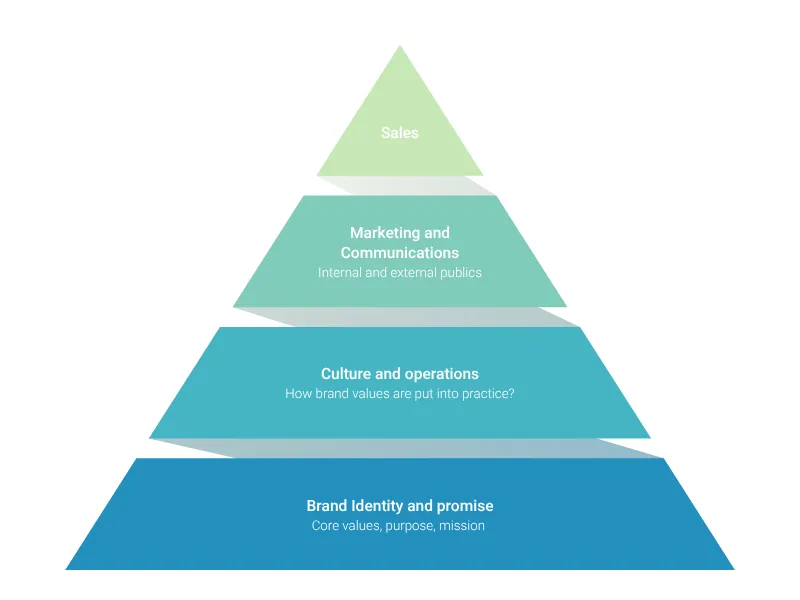
Vertical Funnel Chart Alternatives
Enhance your productivity
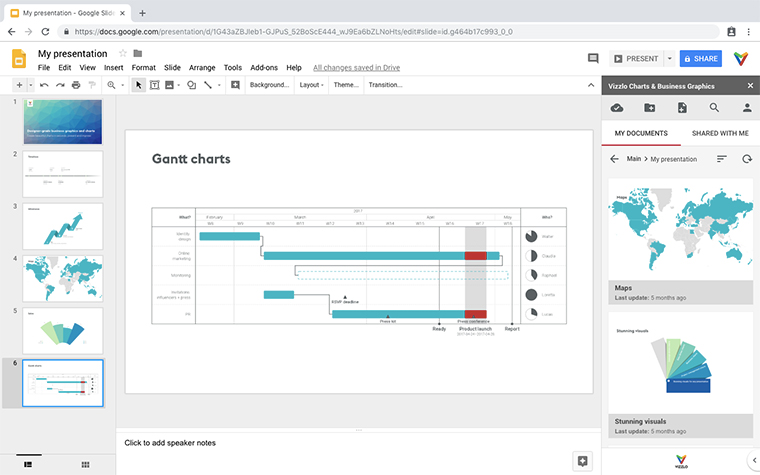
Create a Vertical Funnel Chart directly in the tools you love
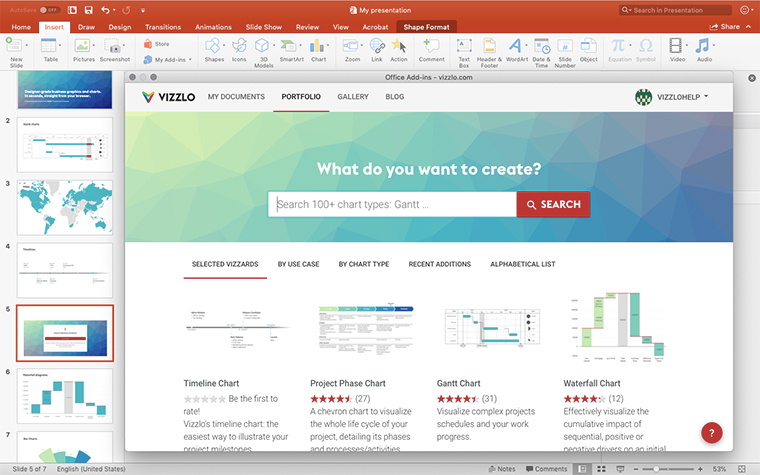
Create a Vertical Funnel Chart in PowerPoint with
Vizzlo's add-in
Loved by professionals around the world


Visualizations your audience won’t forget
Convey abstract concepts and data with professionally designed
charts and graphics you can easily edit and customize.