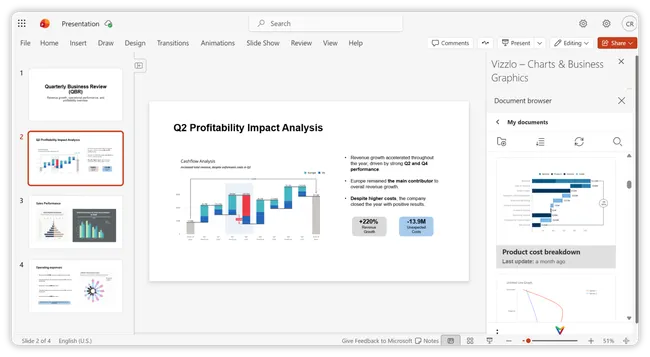







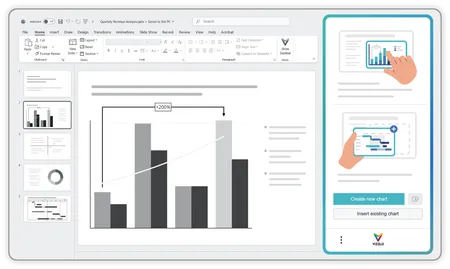
Create and edit charts
seamlessly from PowerPoint
Access Vizzlo directly from the PowerPoint sidebar to
create, edit, and update professional charts—all without
leaving PowerPoint, whether you’re using the desktop
or online version.
More than built-in PowerPoint charts
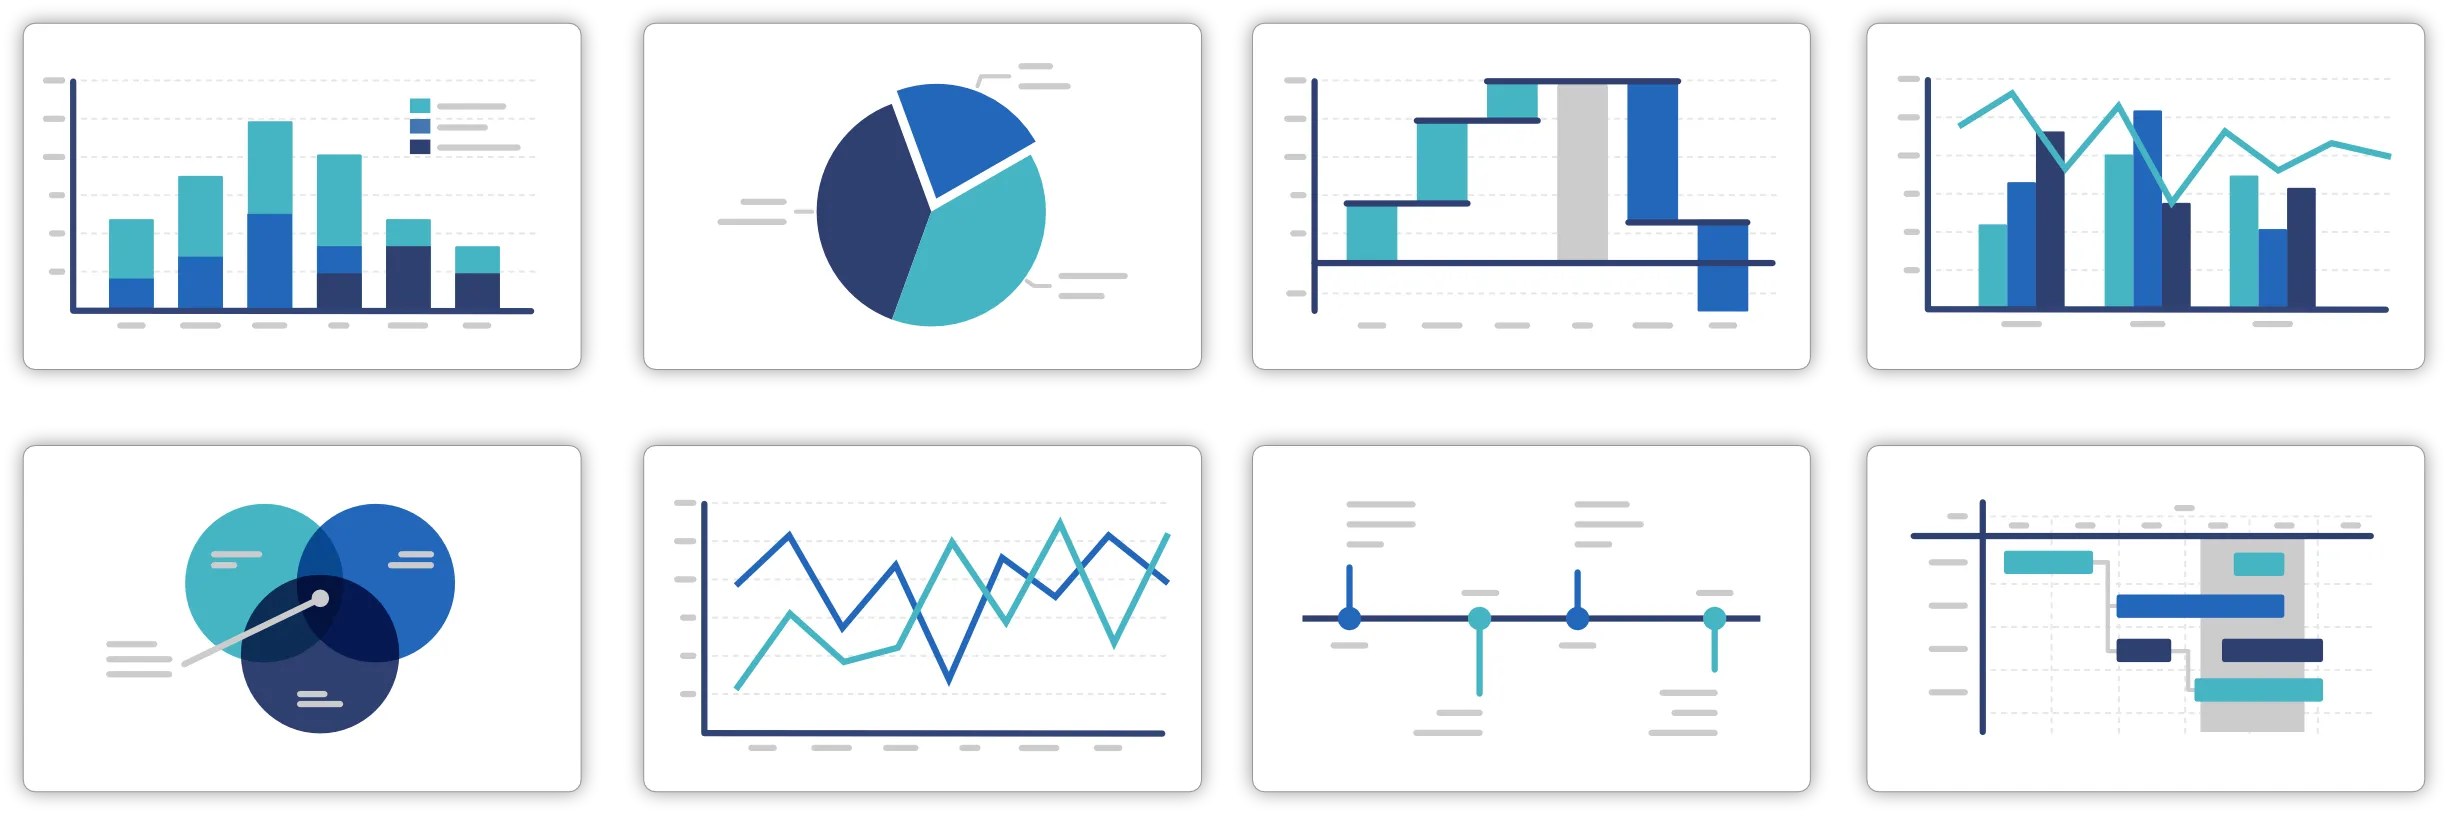
Create everything from Gantt charts and timelines
to waterfall charts, roadmaps, org charts, and KPI dashboards
with over 120 professionally designed chart types.
From spreadsheet to
presentation in seconds
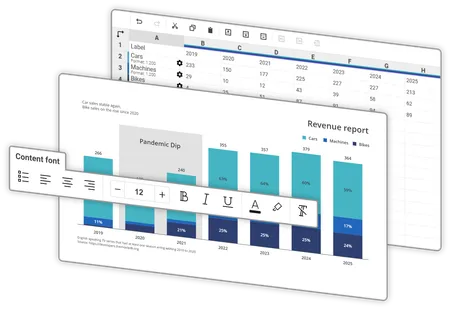
Paste your data, upload a spreadsheet, or connect
cloud files. Vizzlo automatically structures your
information so you can focus on presenting
your insights.
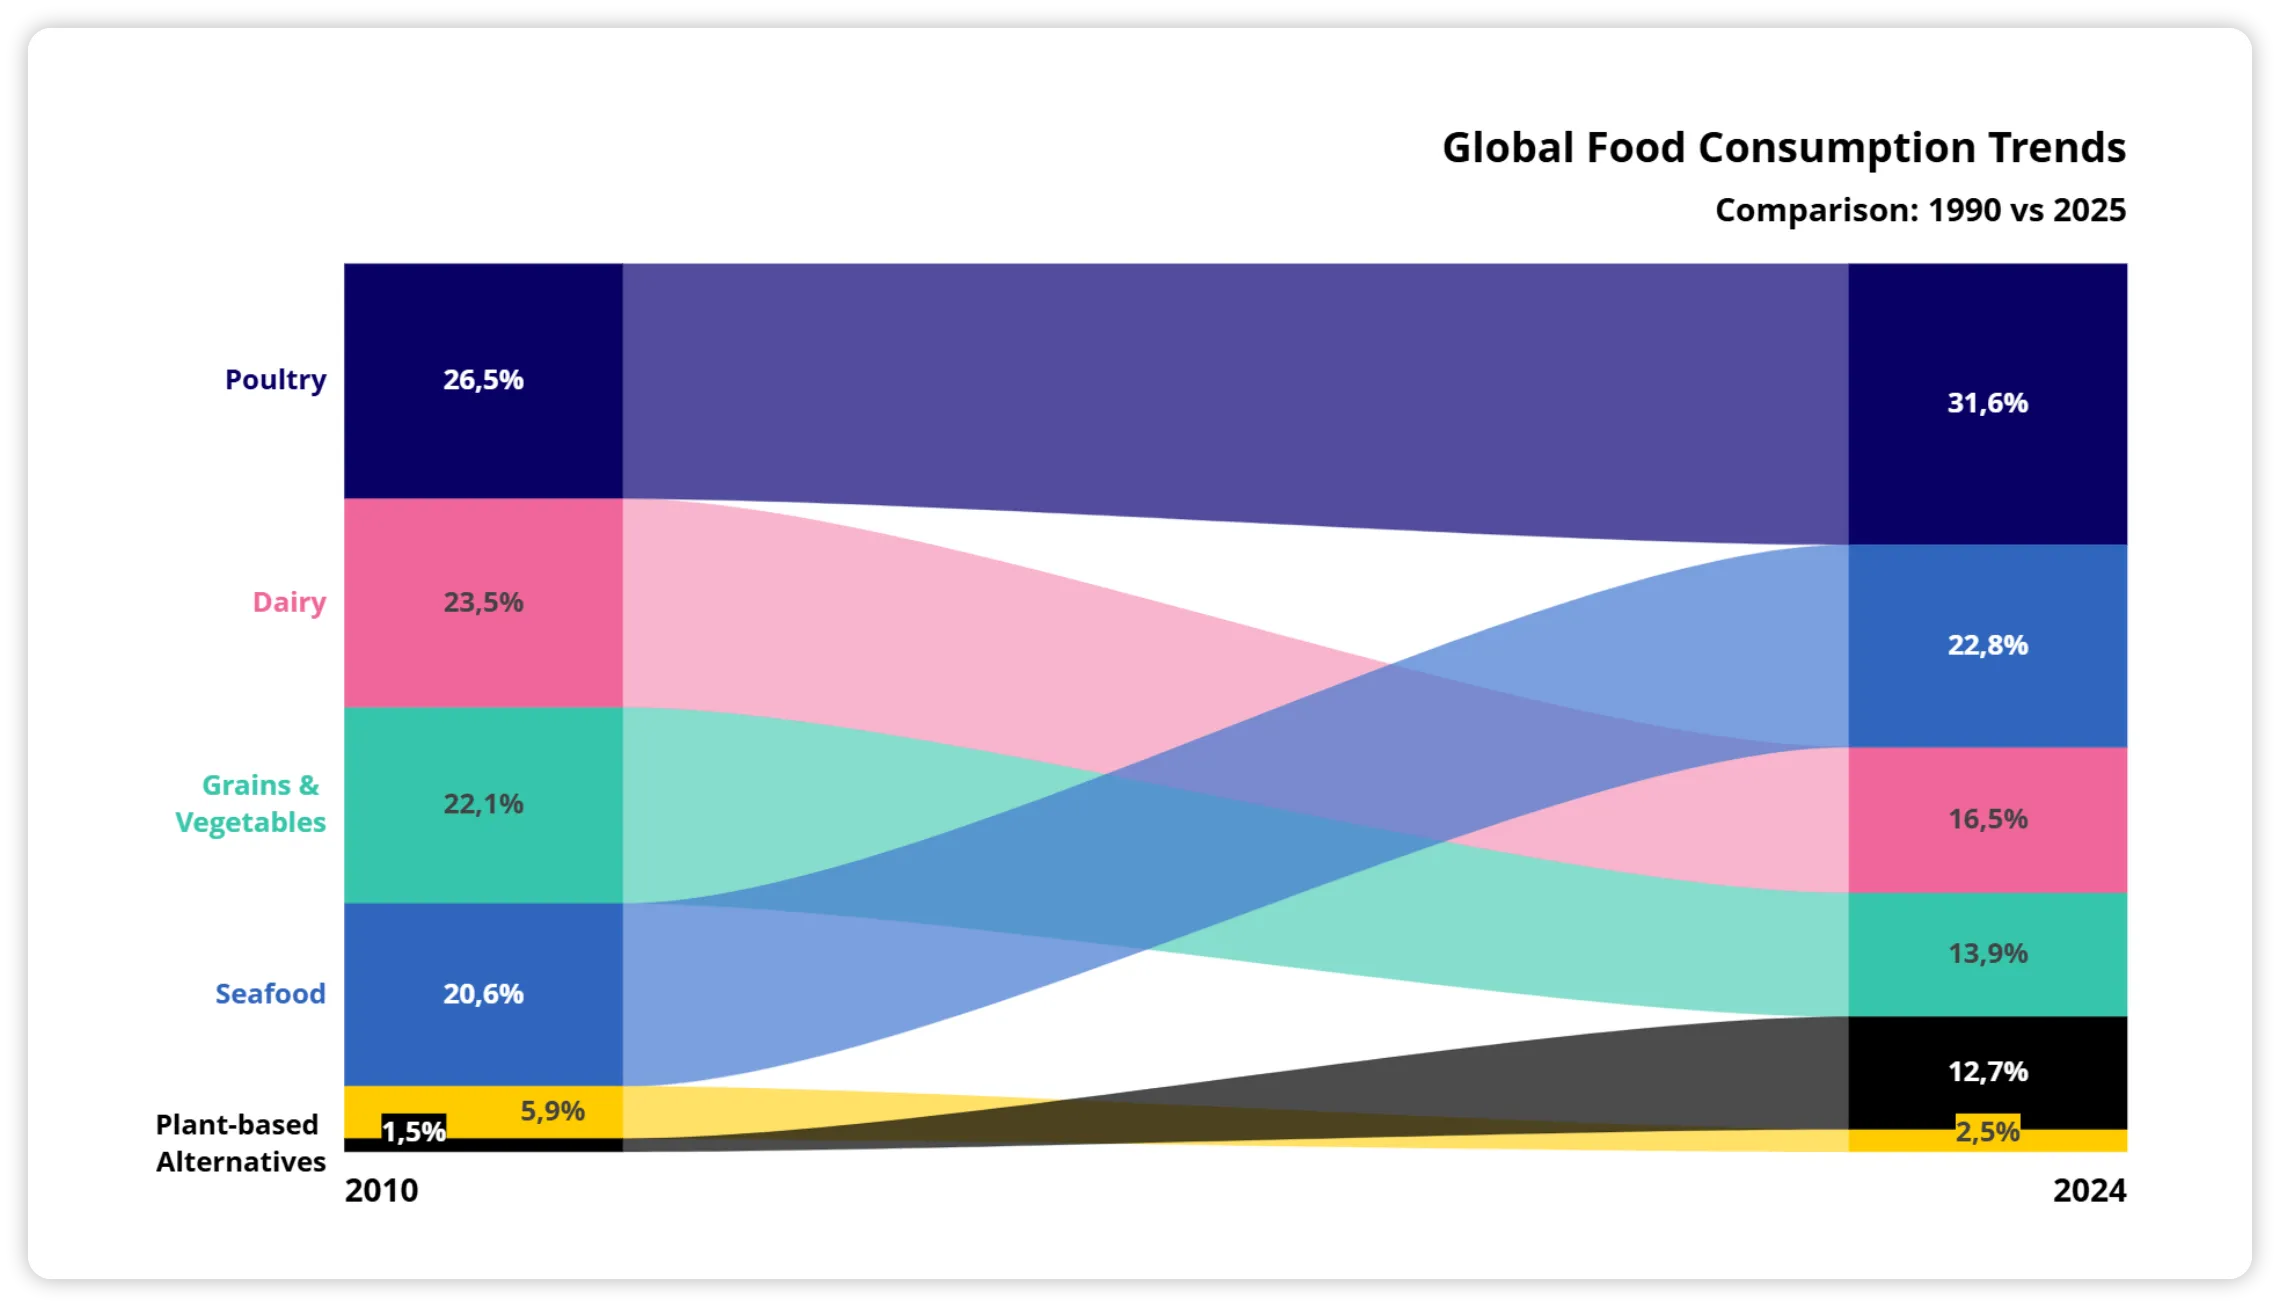
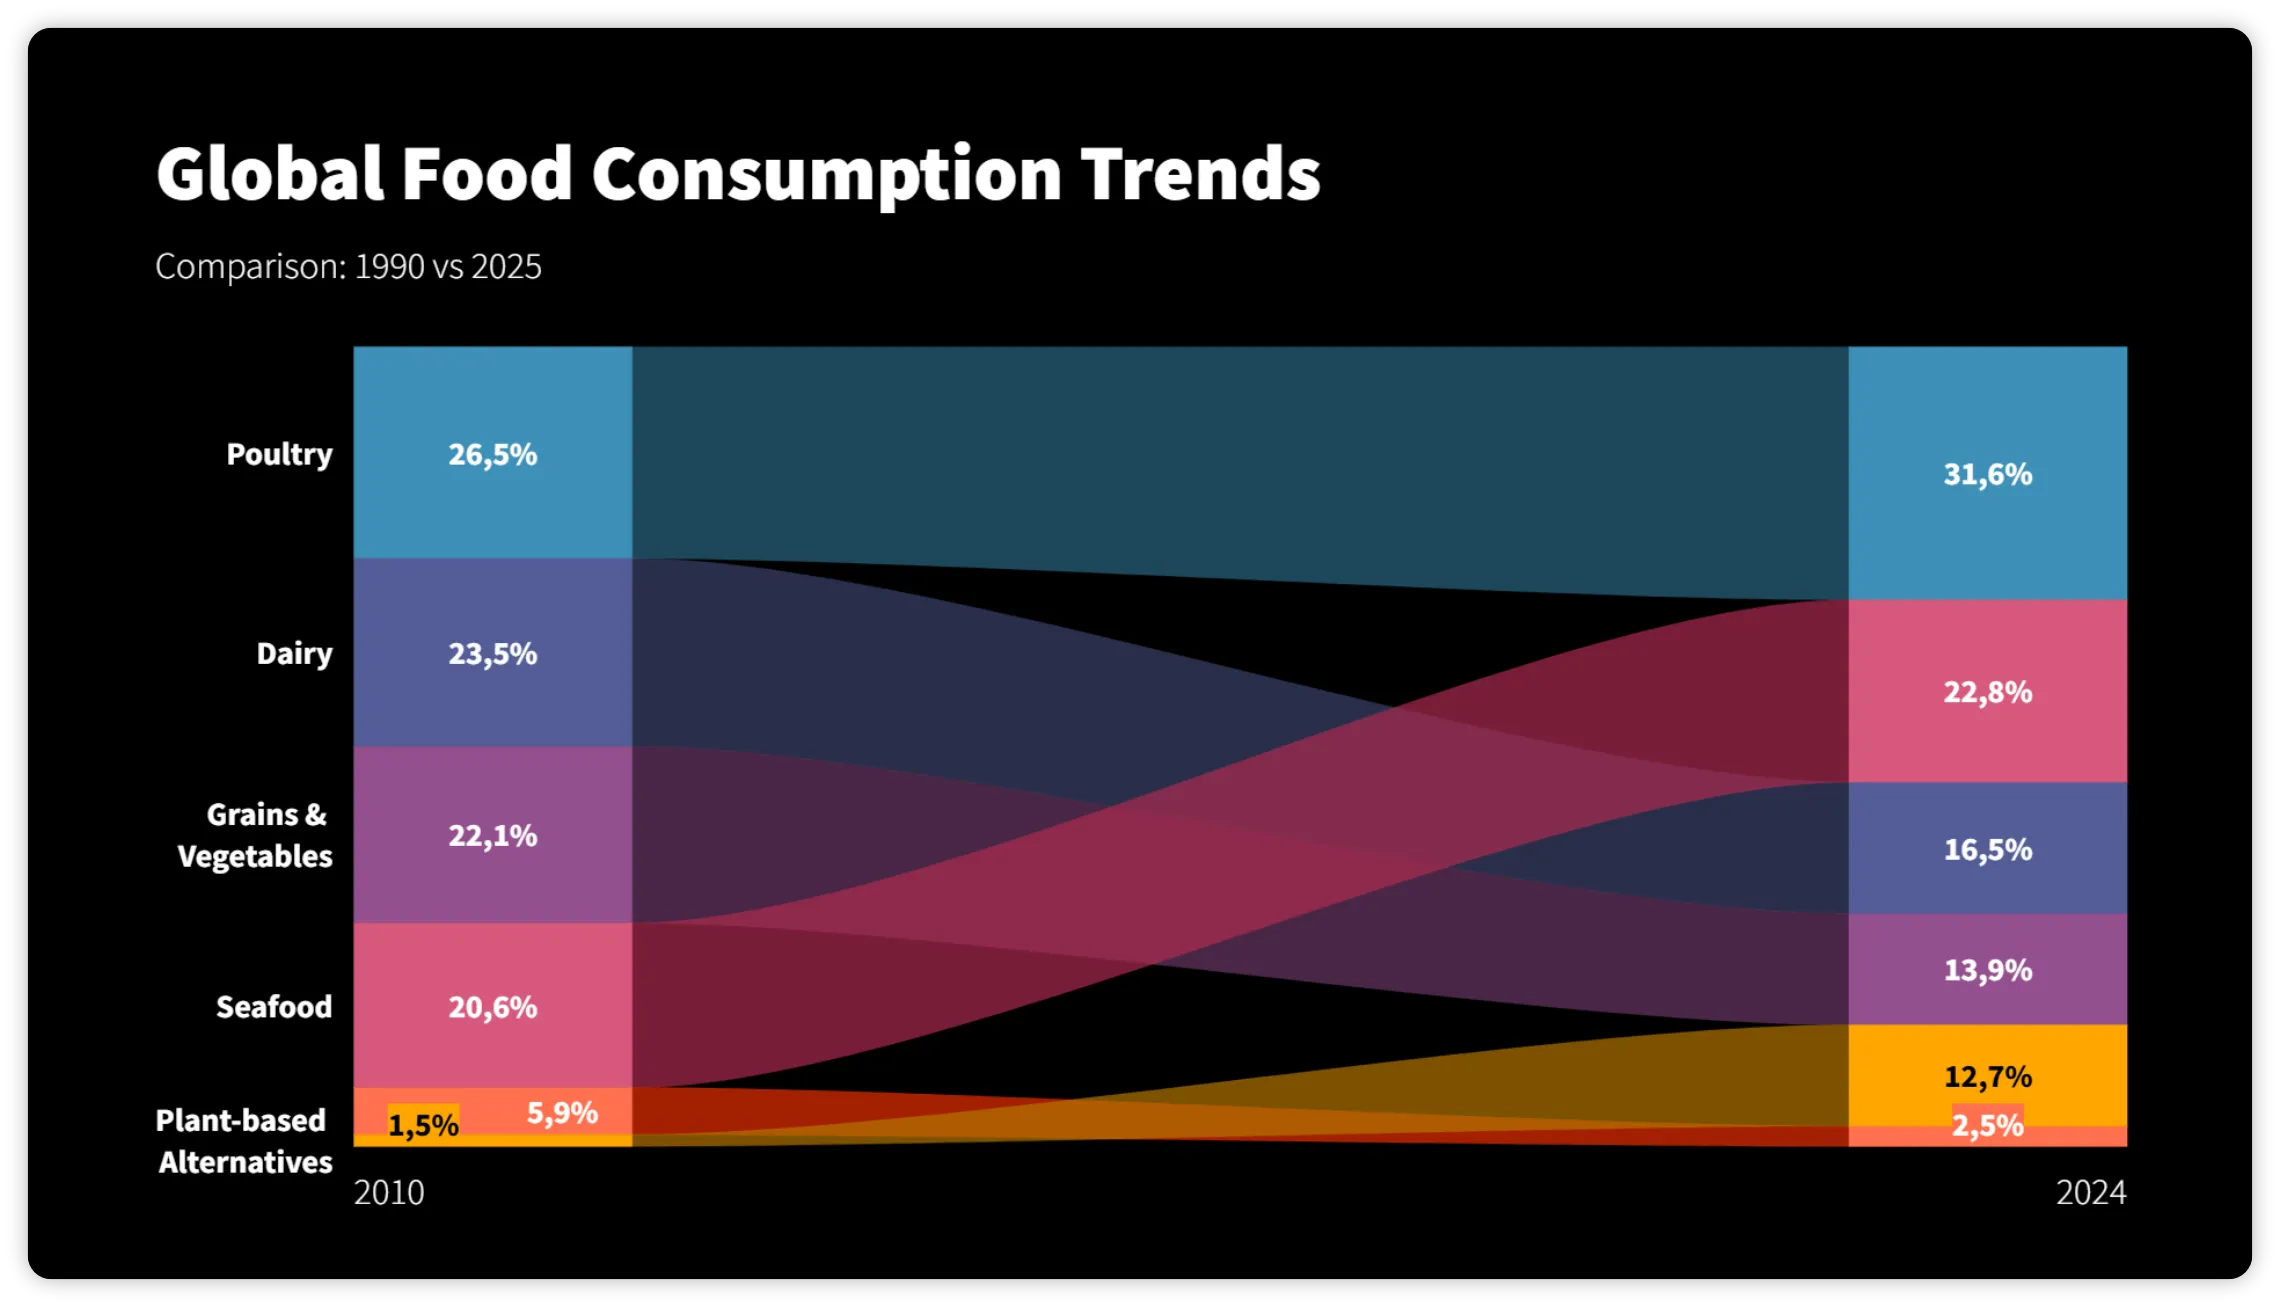
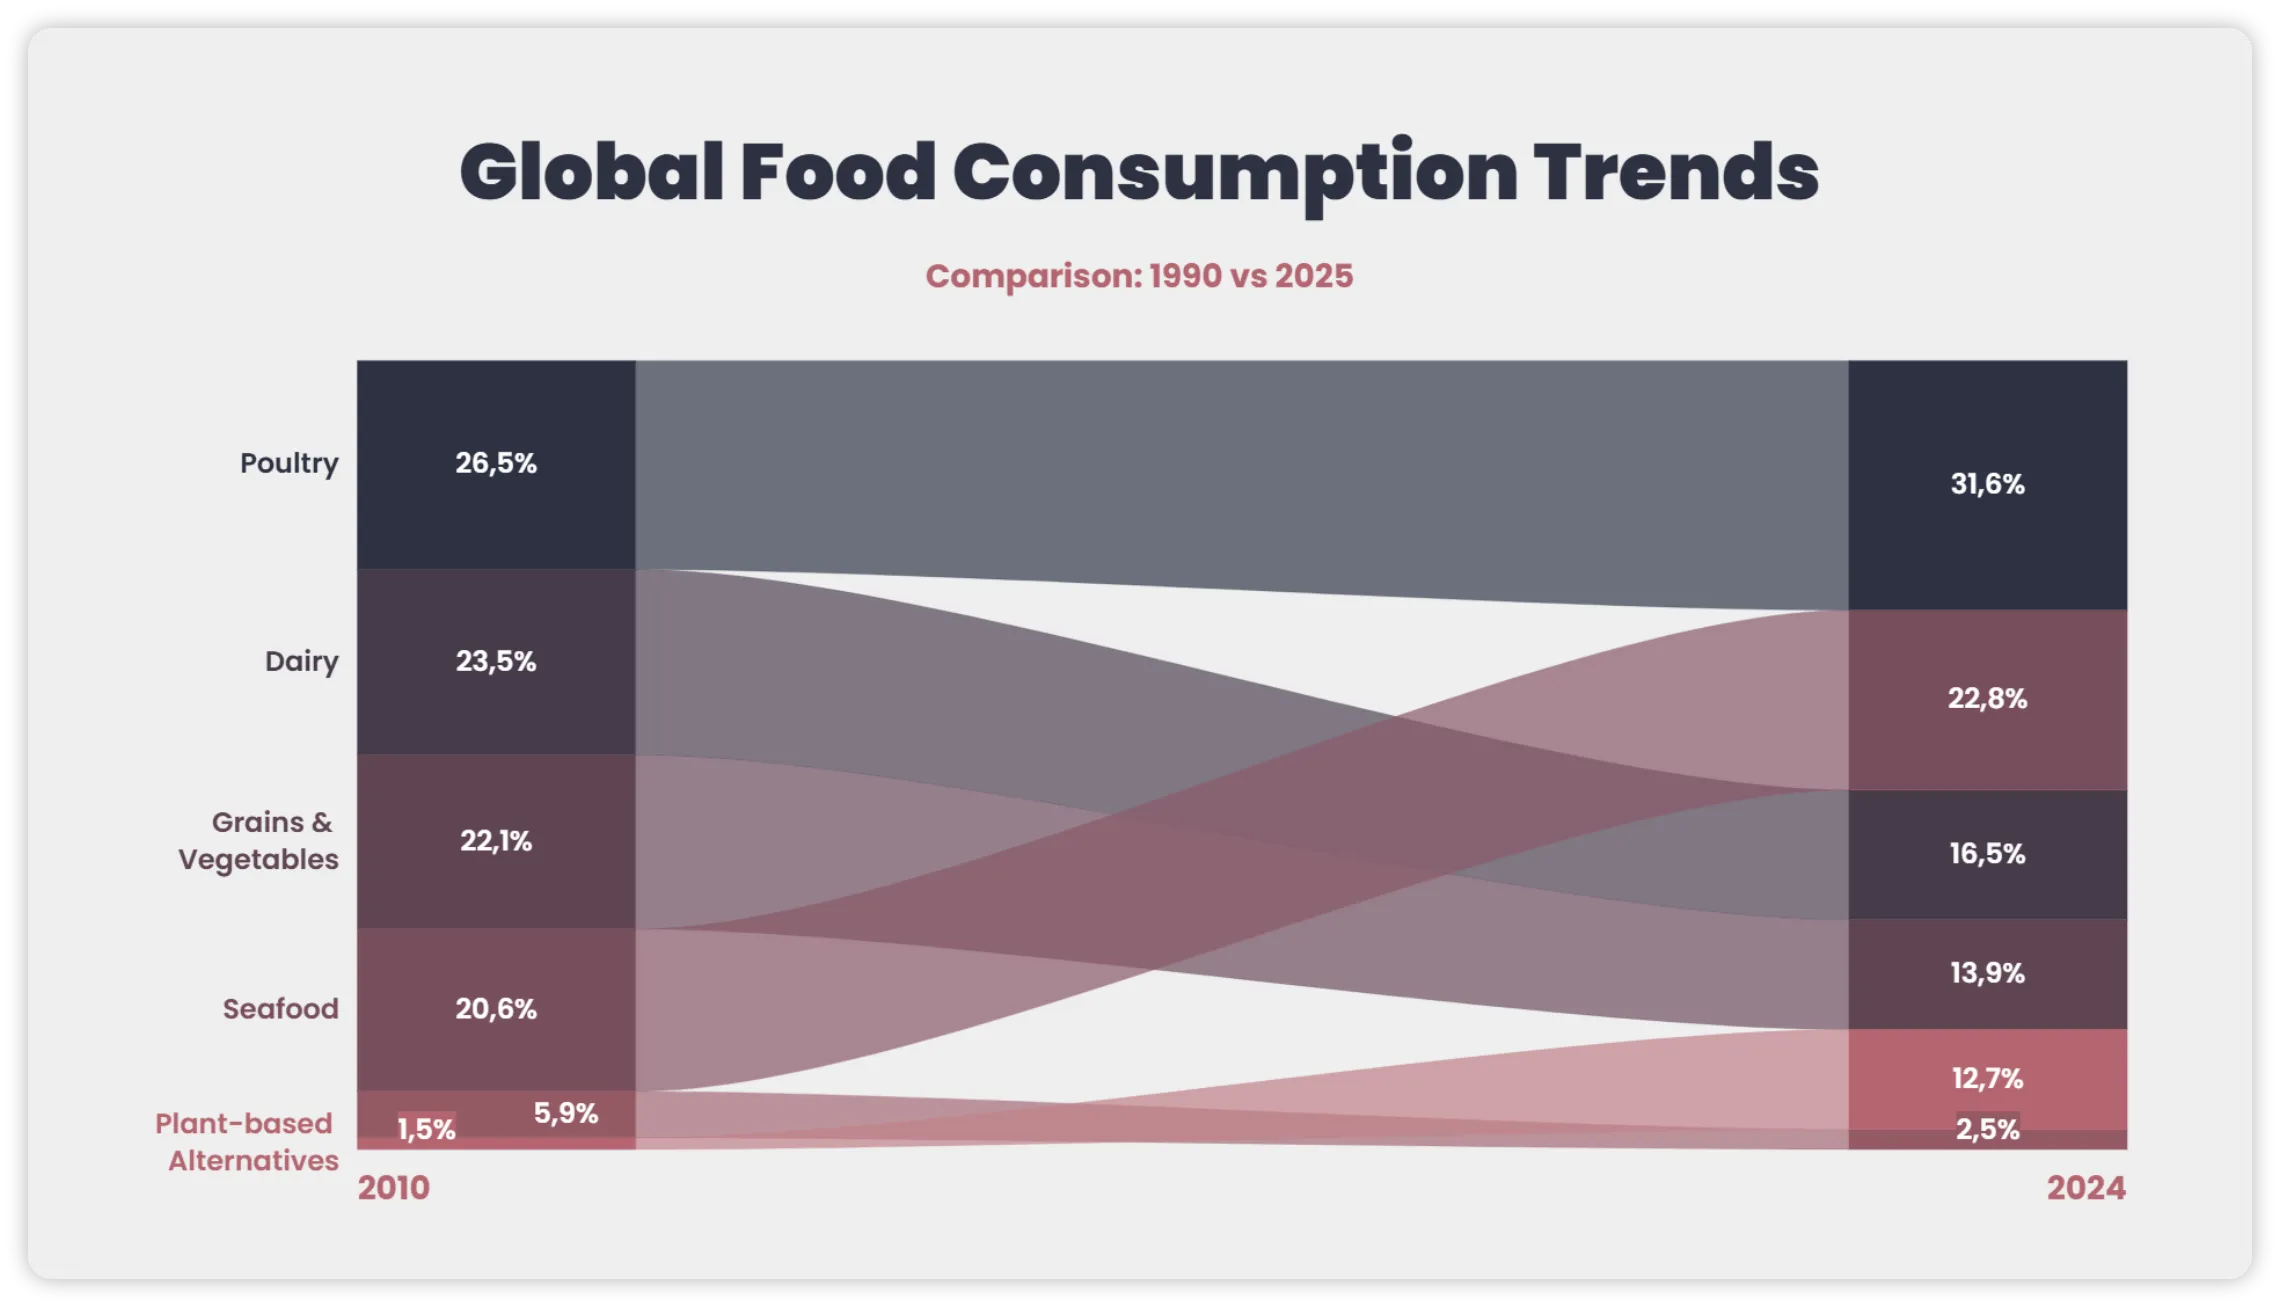
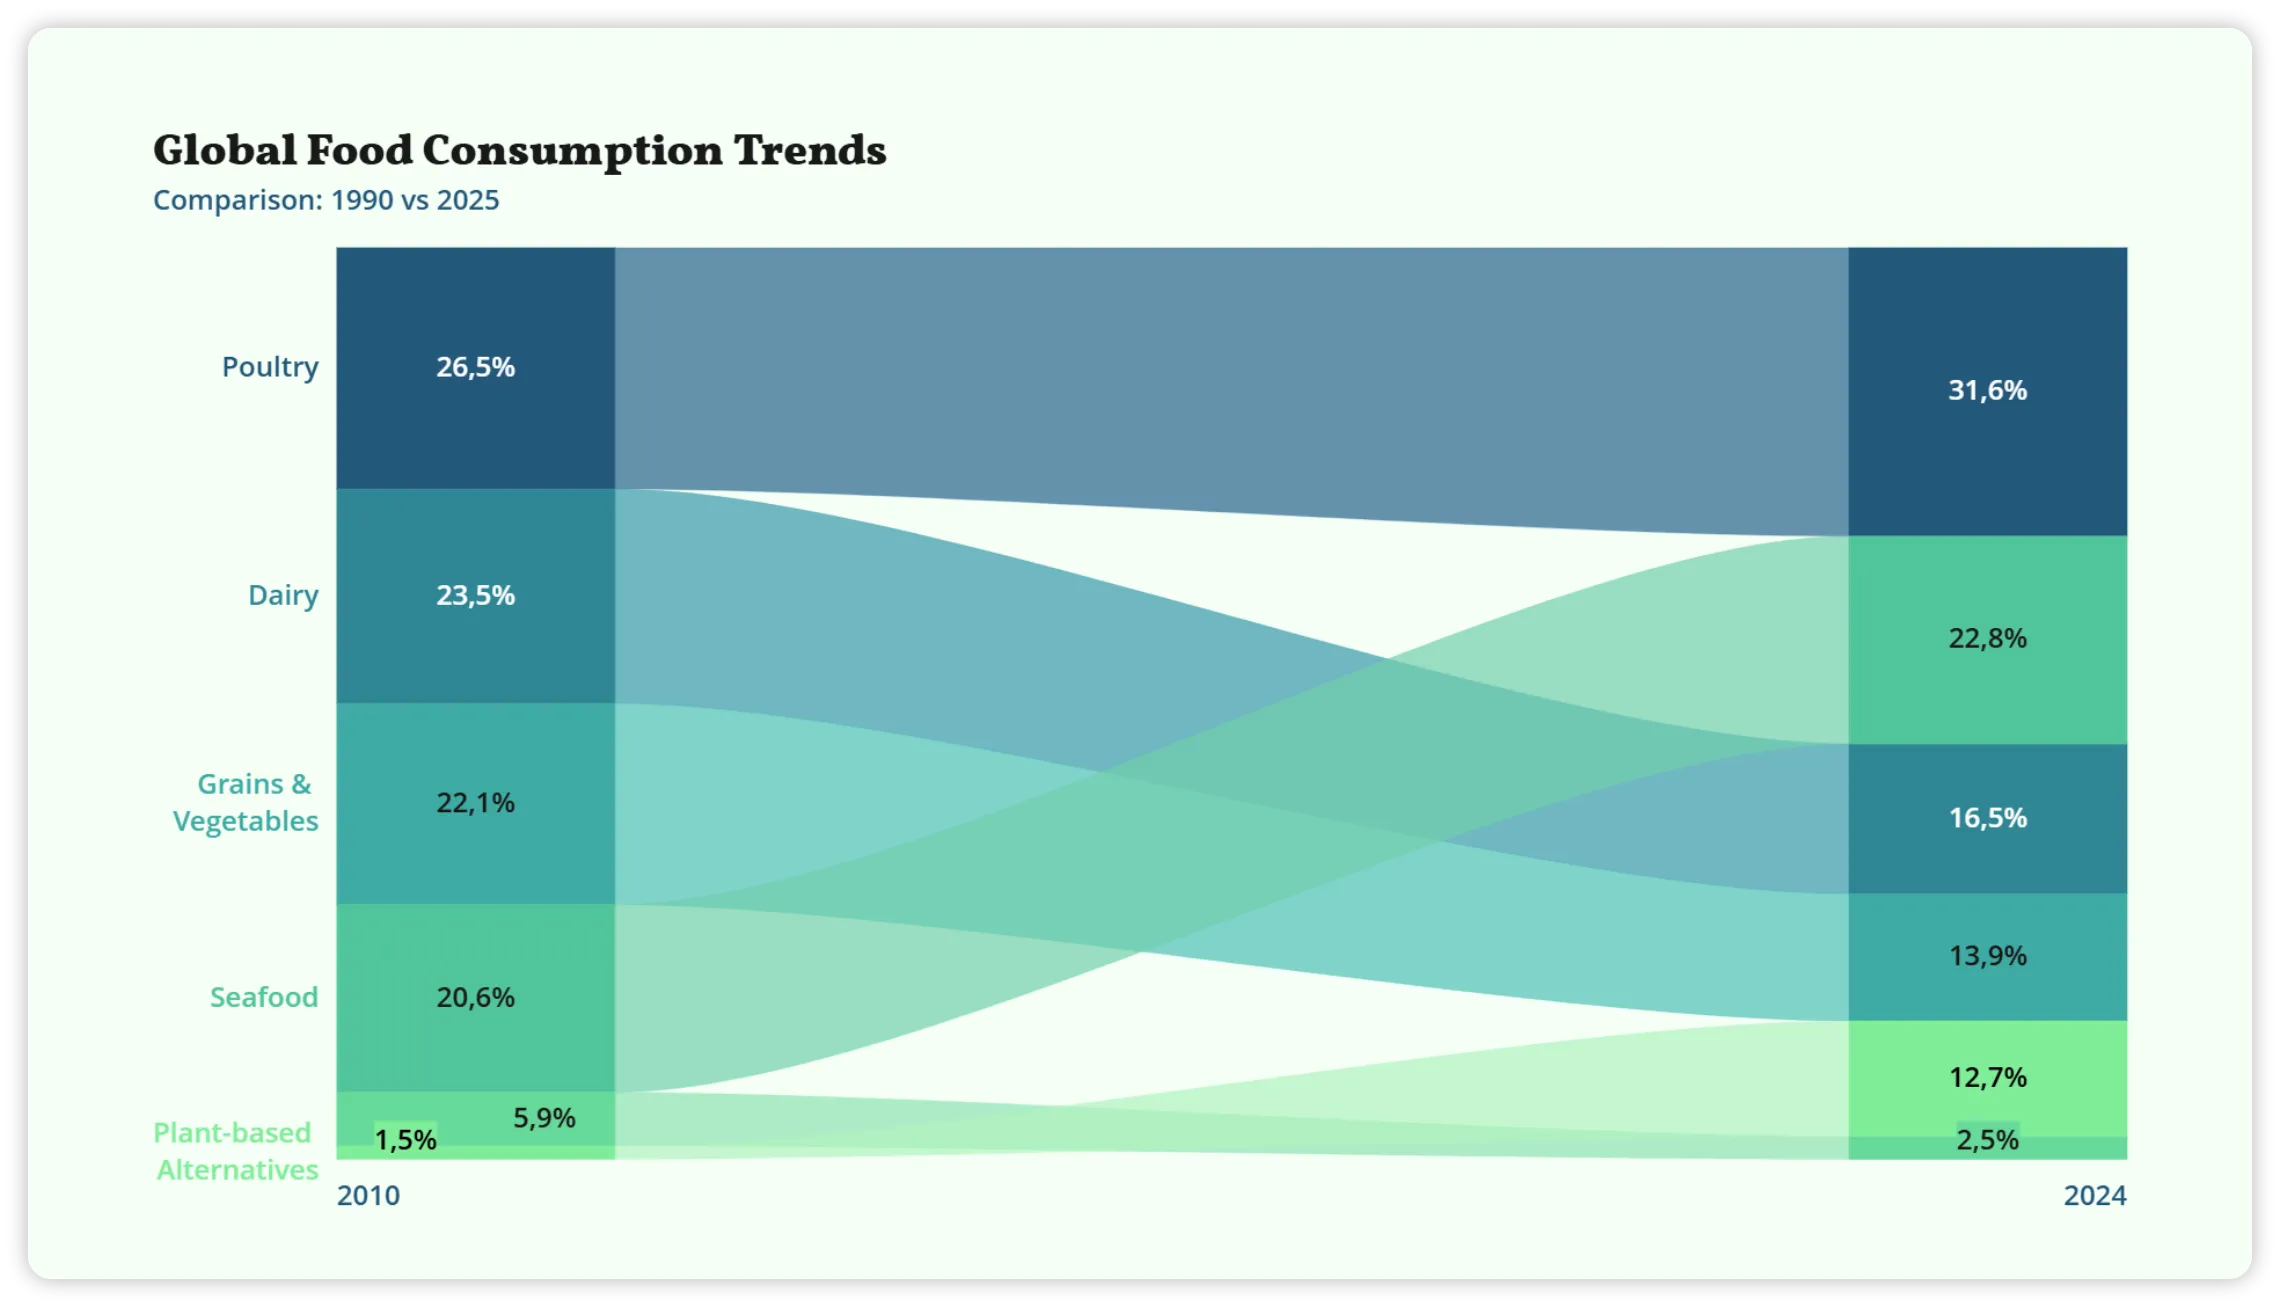
Consistent charts across
every presentation
Apply shared themes, reuse charts across
presentations, and ensure every visual follows
your company’s design standards.

Make your insights stand out
Use visual highlights, annotations, and styling options to
draw attention to the most important trends and key
messages in your charts.

Keep charts in sync
Connect charts to cloud files or public data sources and automatically reflect the latest changes across your presentations.

Enterprise security built in
Manage users, permissions, and licenses with enterprise-grade security features designed for organizations of any size.
Enterprise details
Create charts with AI
Turn a prompt into a fully editable chart in seconds. Refine the result and customize every detail.
Create with AI