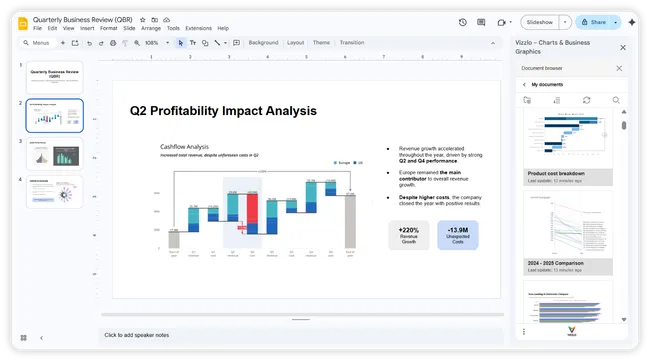


Create and manage charts
seamlessly from Google Slides
Access your Vizzlo charts directly from the Google Slides
sidebar, create new visuals in seconds, and keep your
presentation workflow moving without jumping between tools.
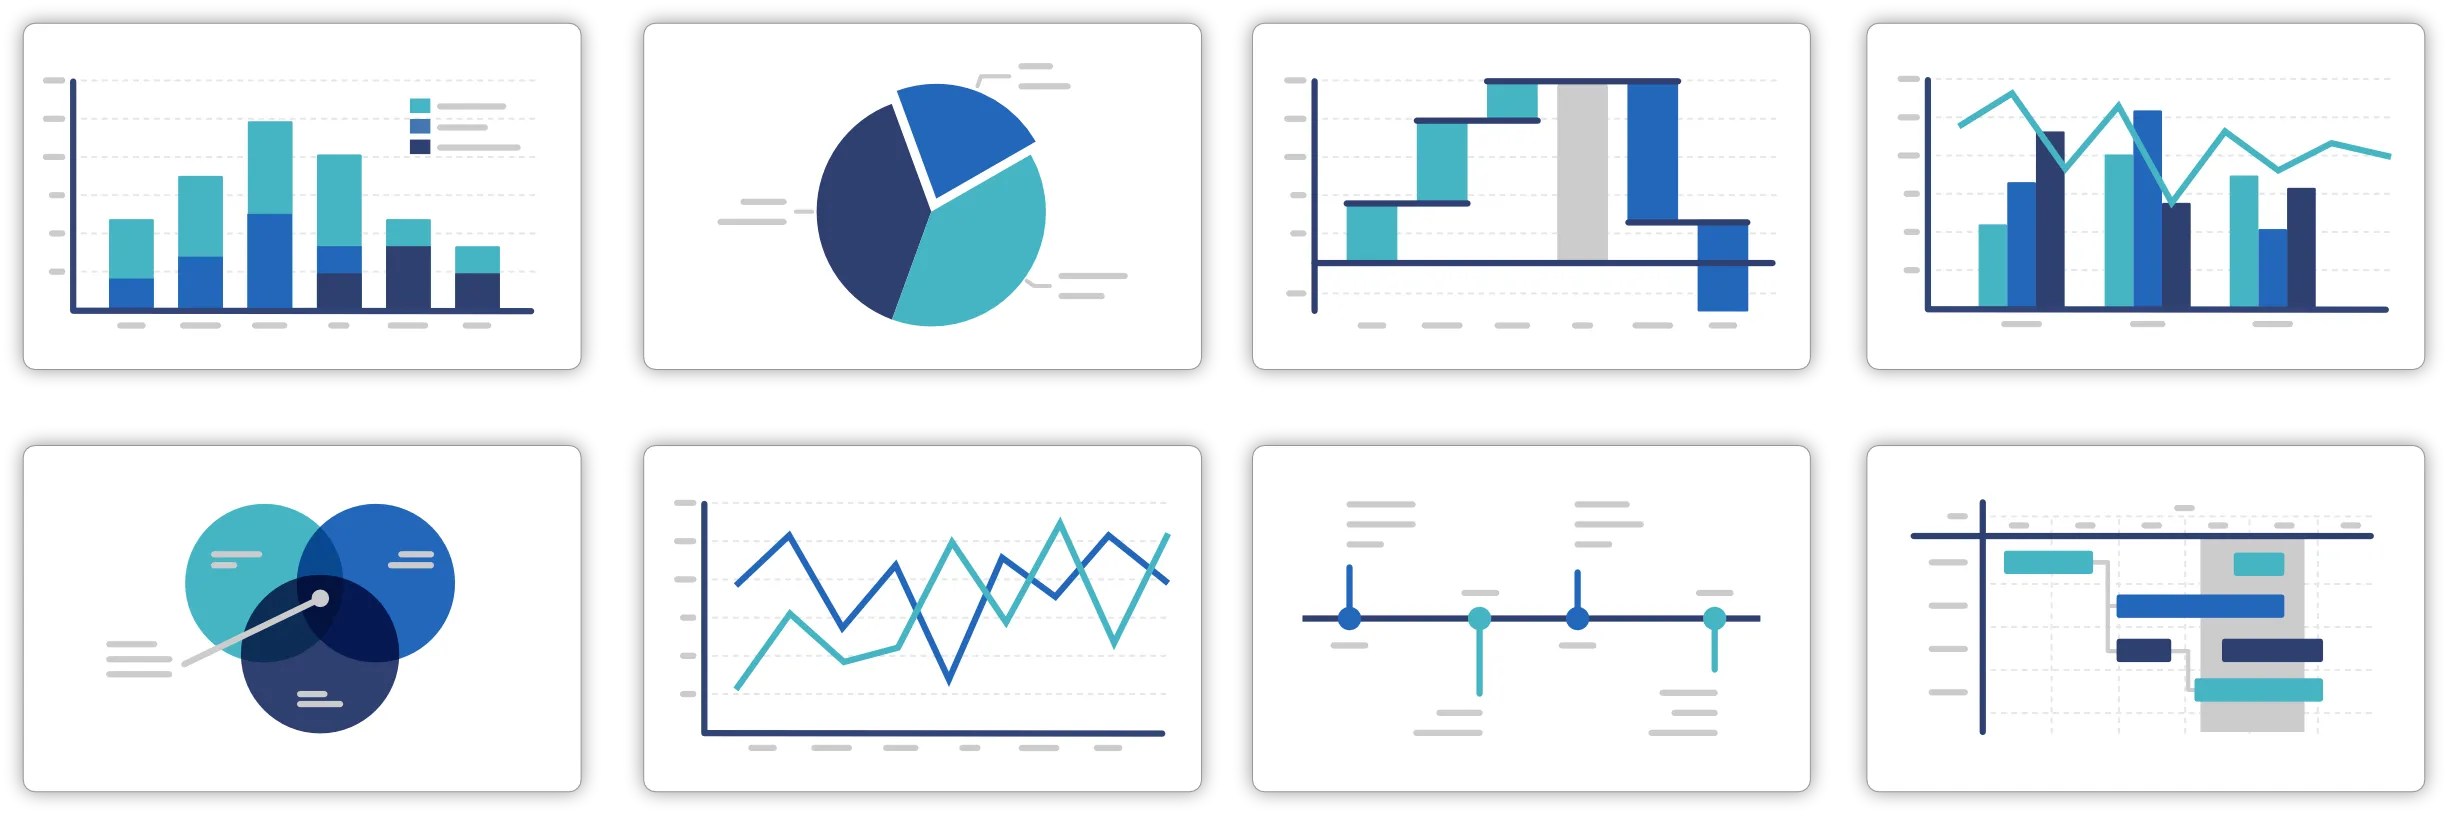
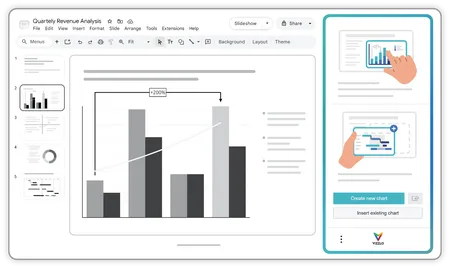
Go beyond default Google Slides charts
From project planning and roadmaps to KPI reporting
and executive presentations, choose from 120+ professional
chart types built for modern presentation workflows.
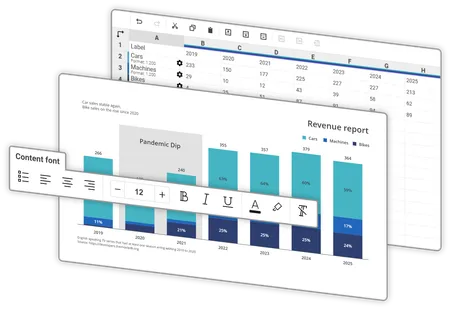
From data to presentation-ready
charts in seconds
Paste your data, upload a file, or connect cloud
files. Vizzlo handles the structure and formatting
so you can create charts faster and spend less
time rebuilding them manually.
Built for recurring reporting and
consistent branding
Reuse charts across presentations, apply shared
themes and templates, and keep every report
aligned with your company’s design standards.
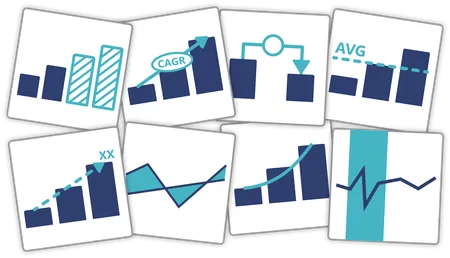
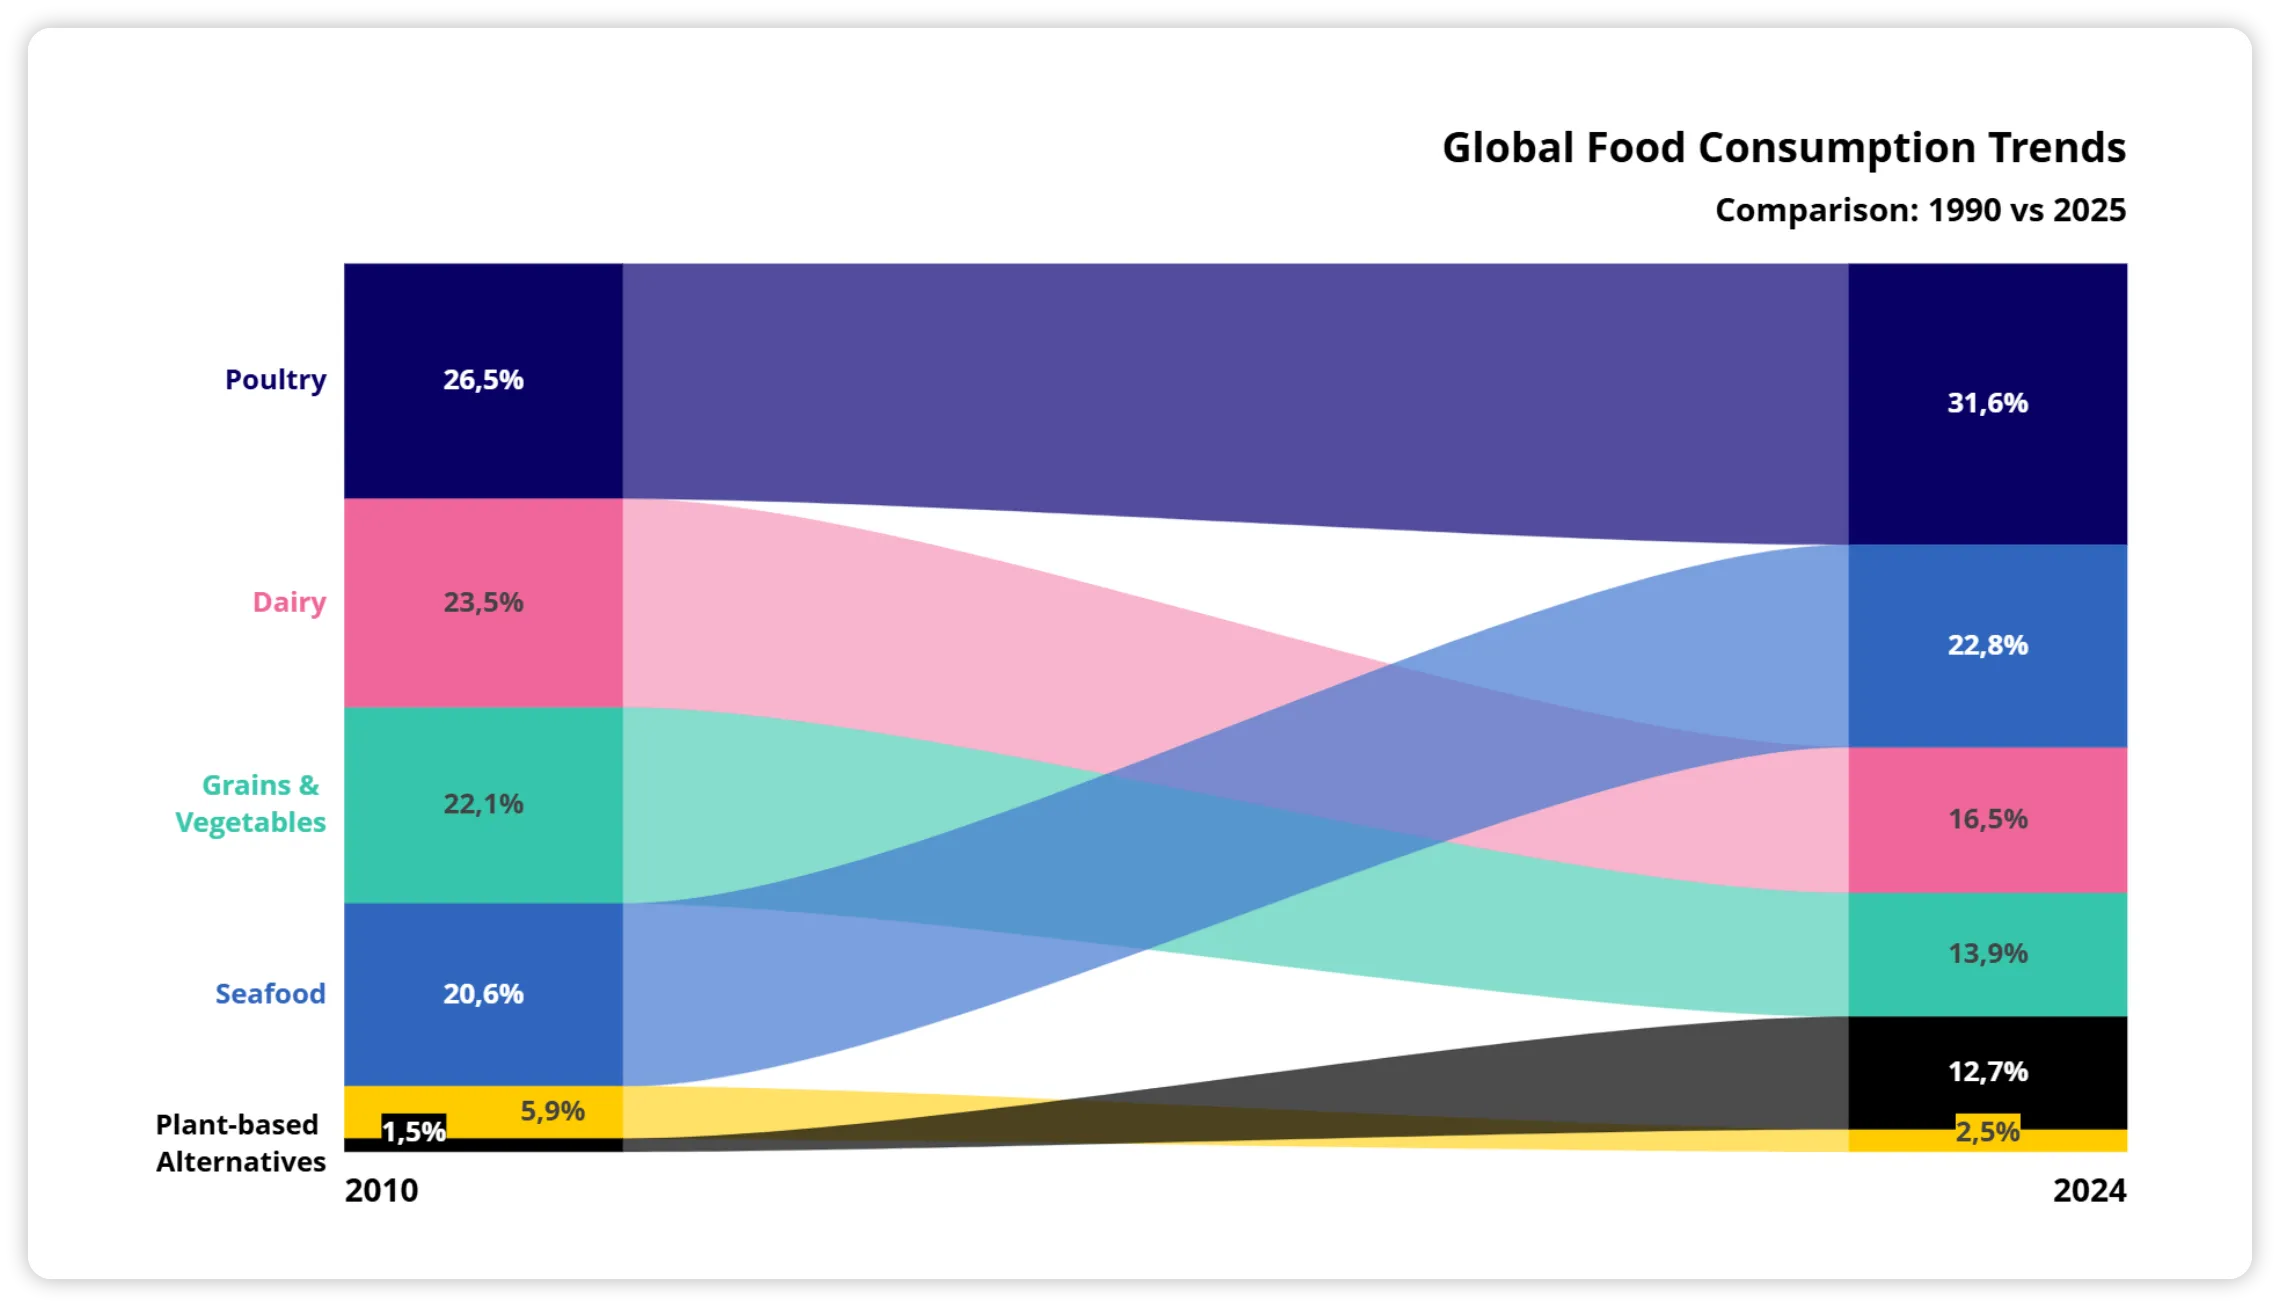
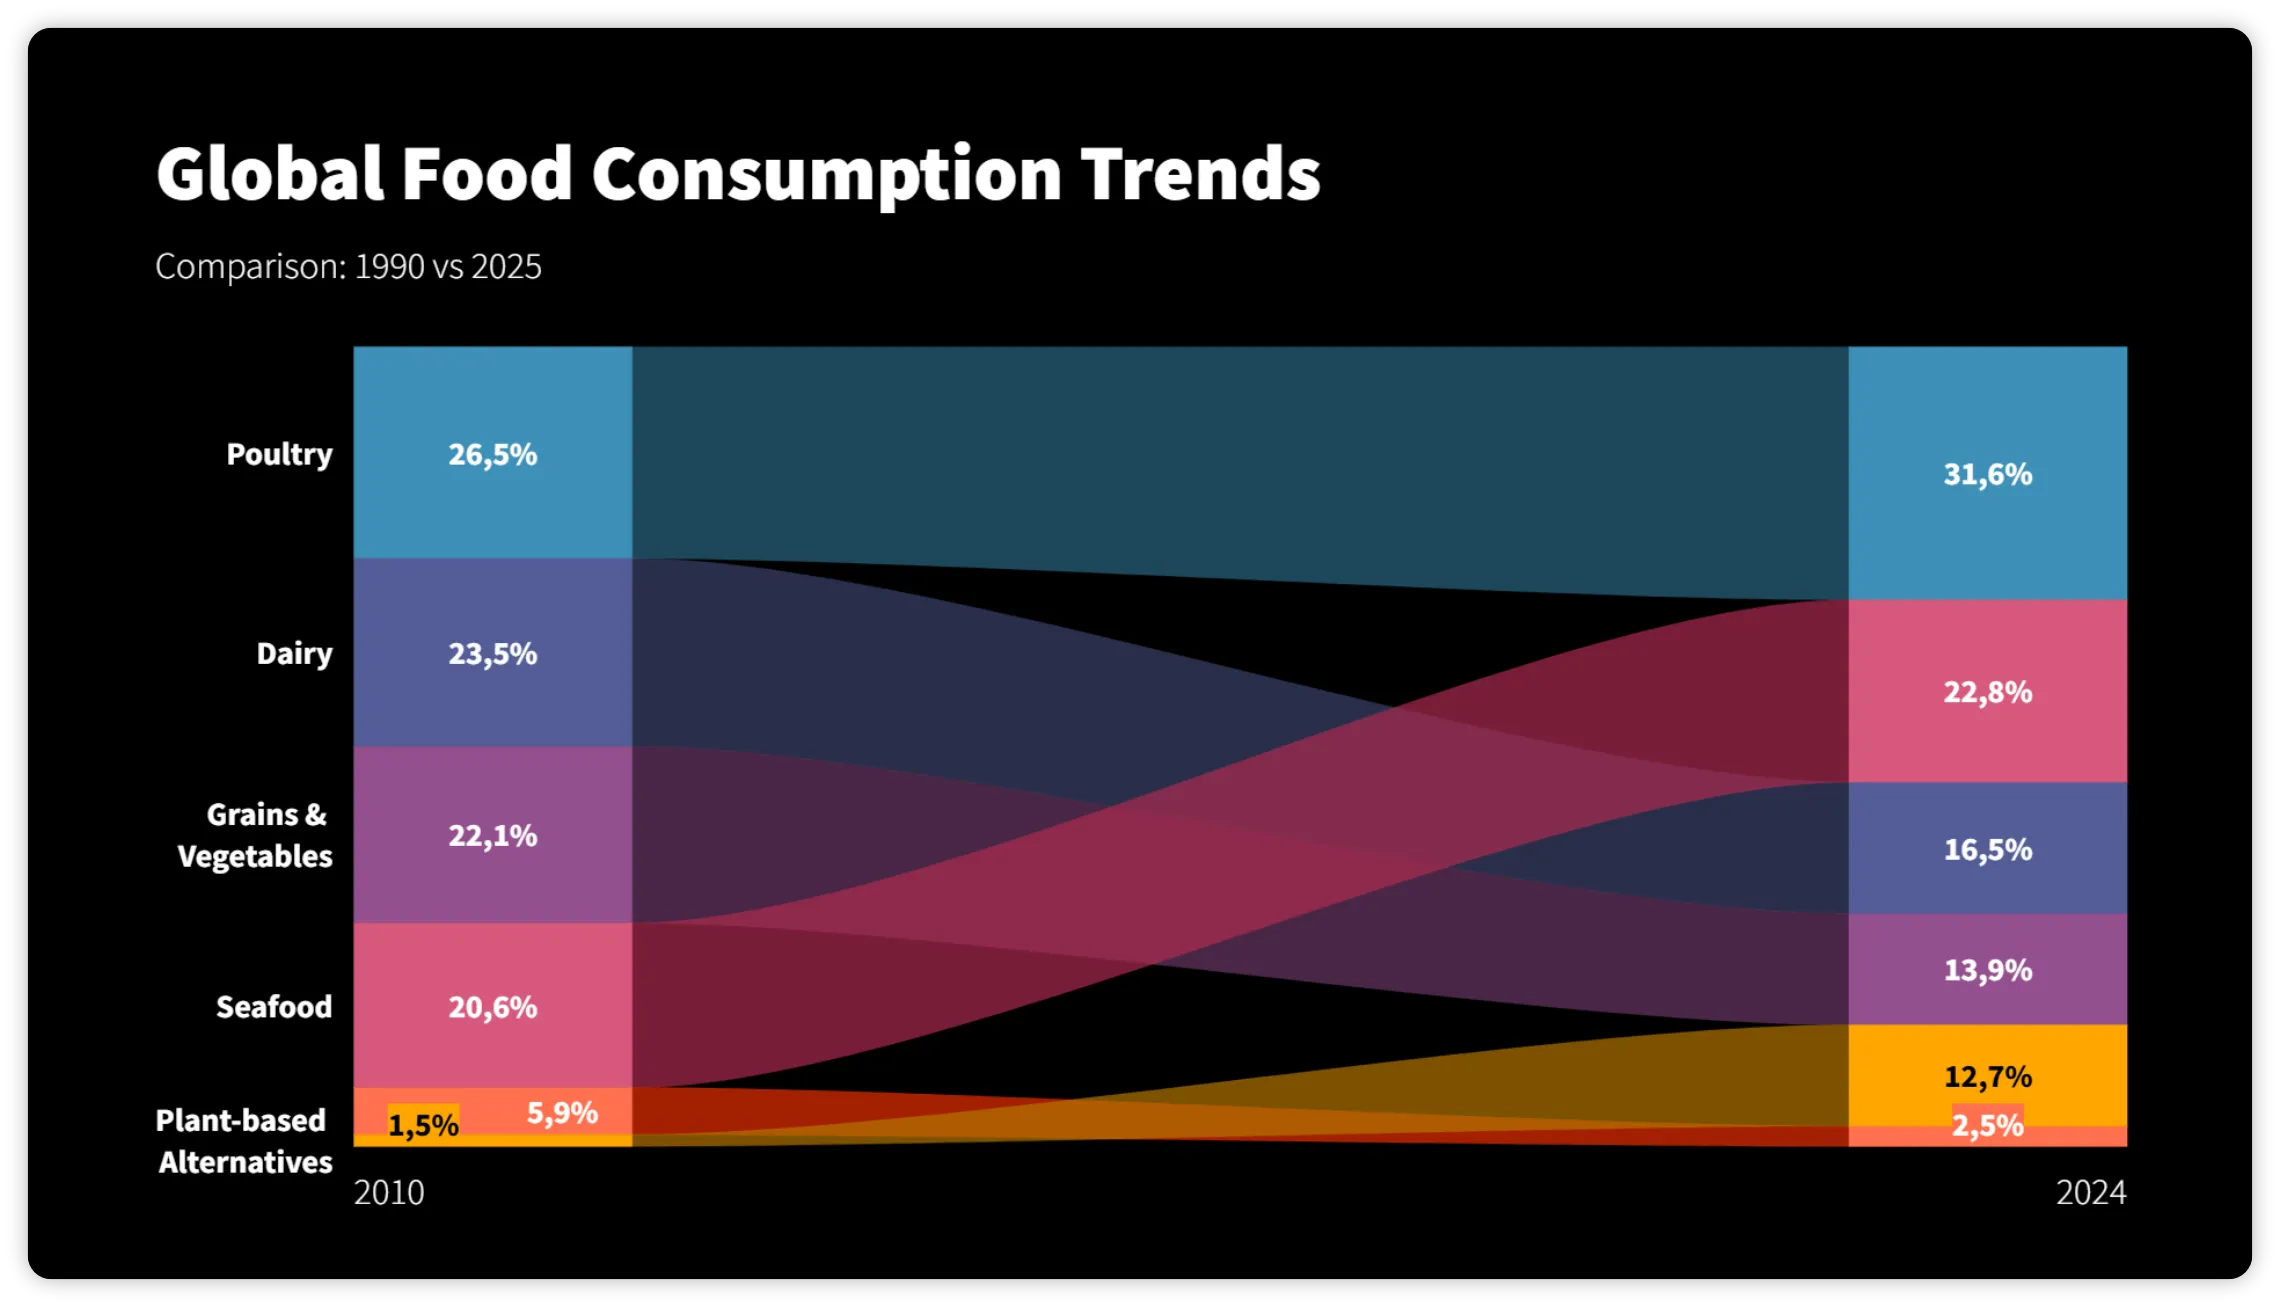
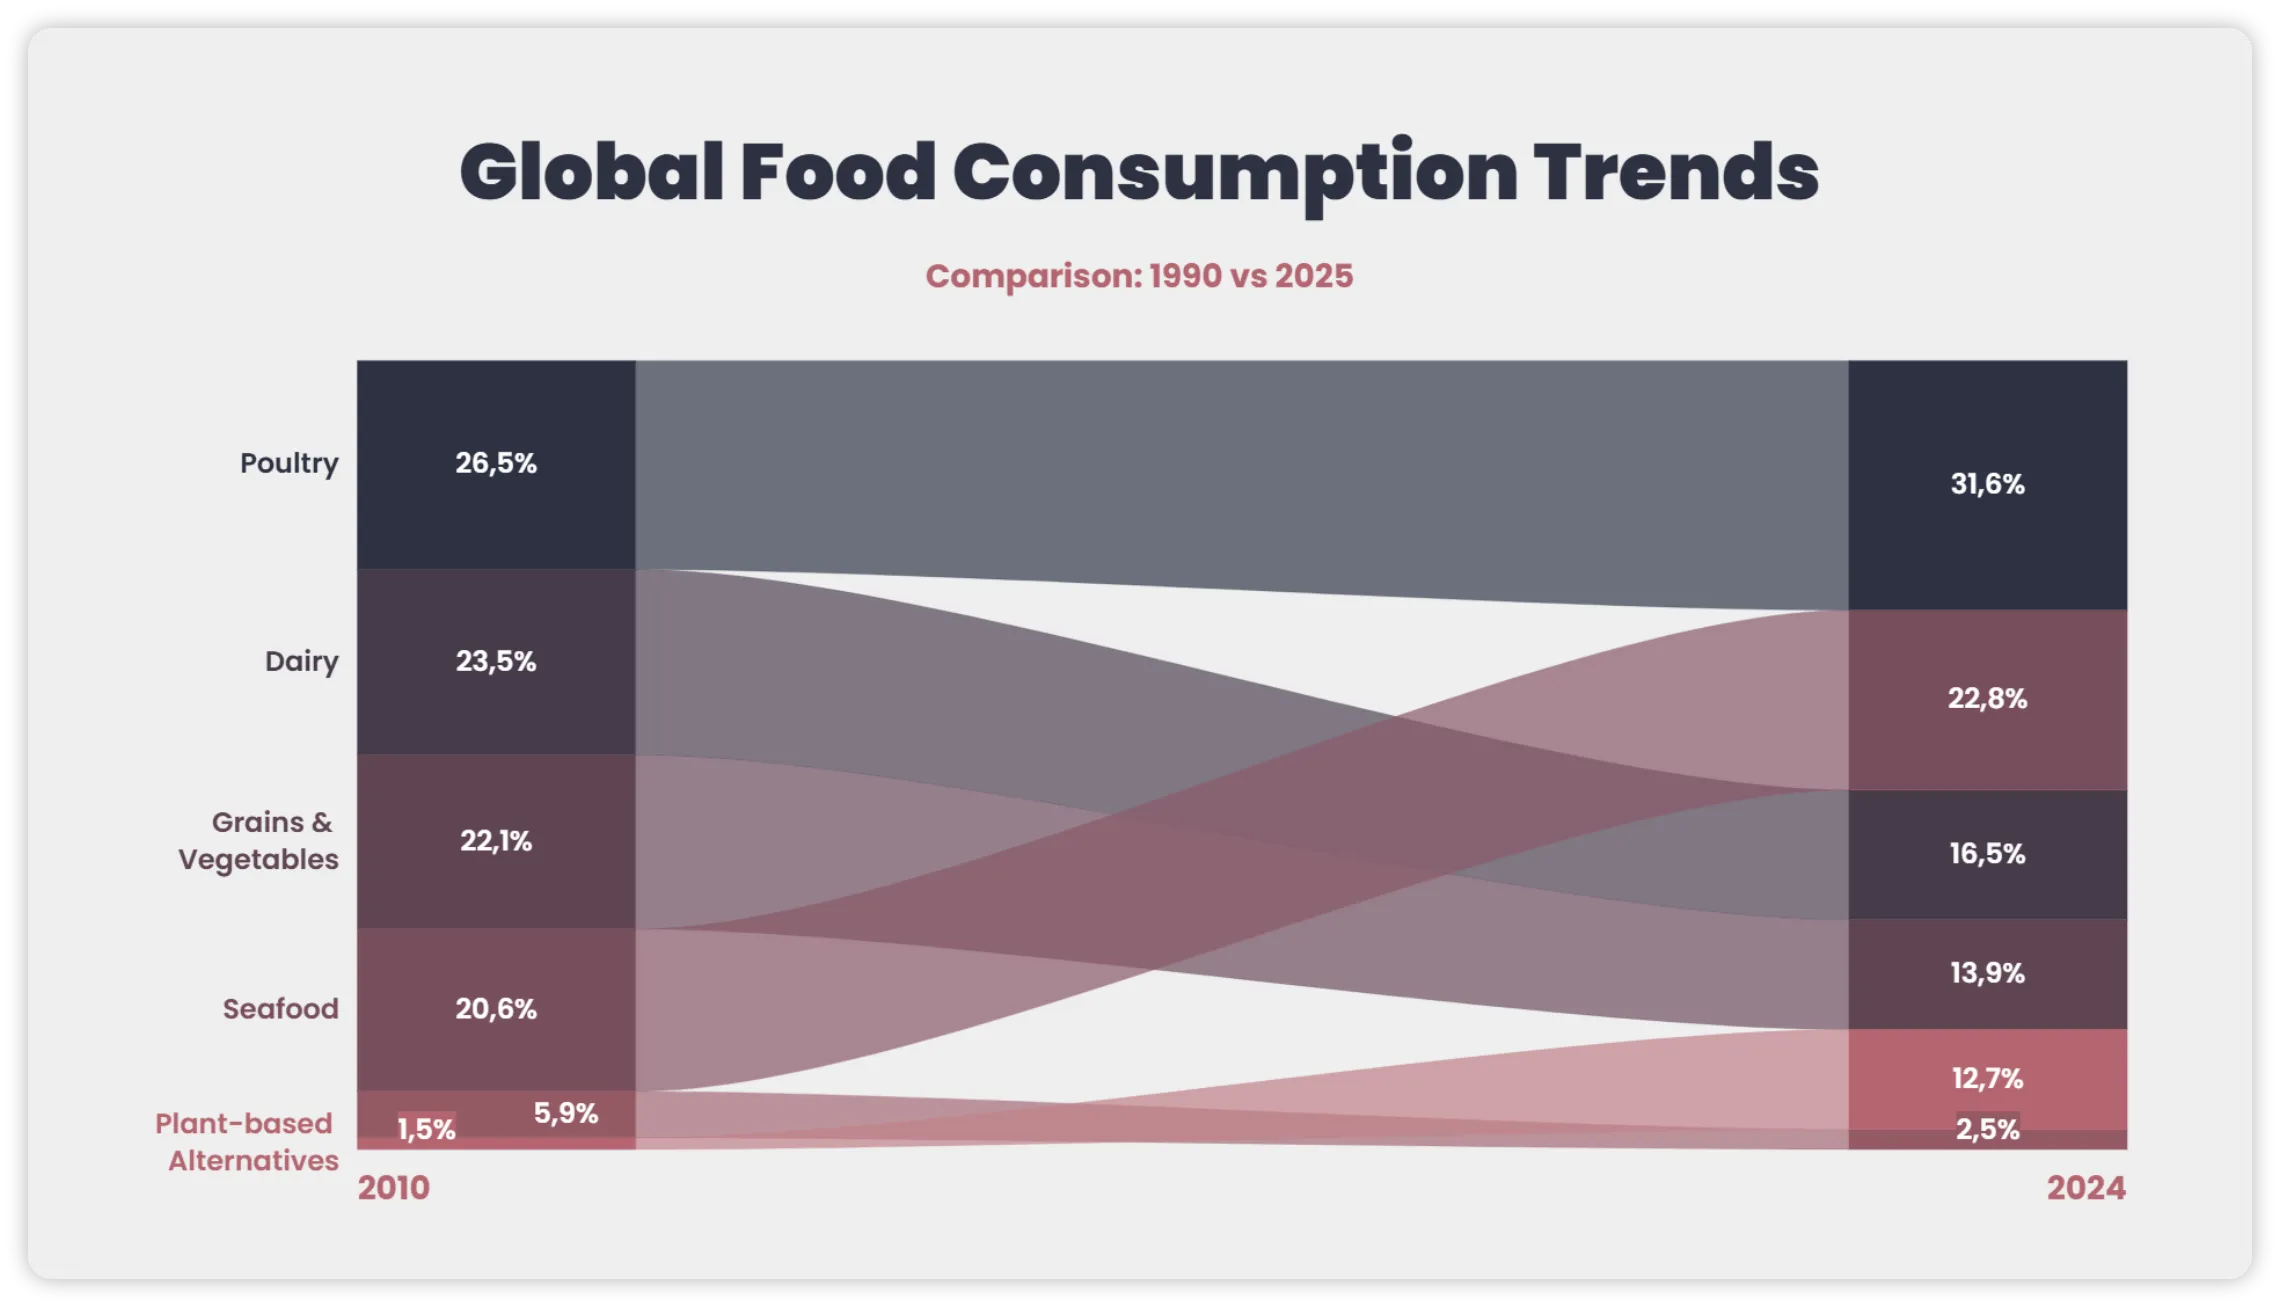
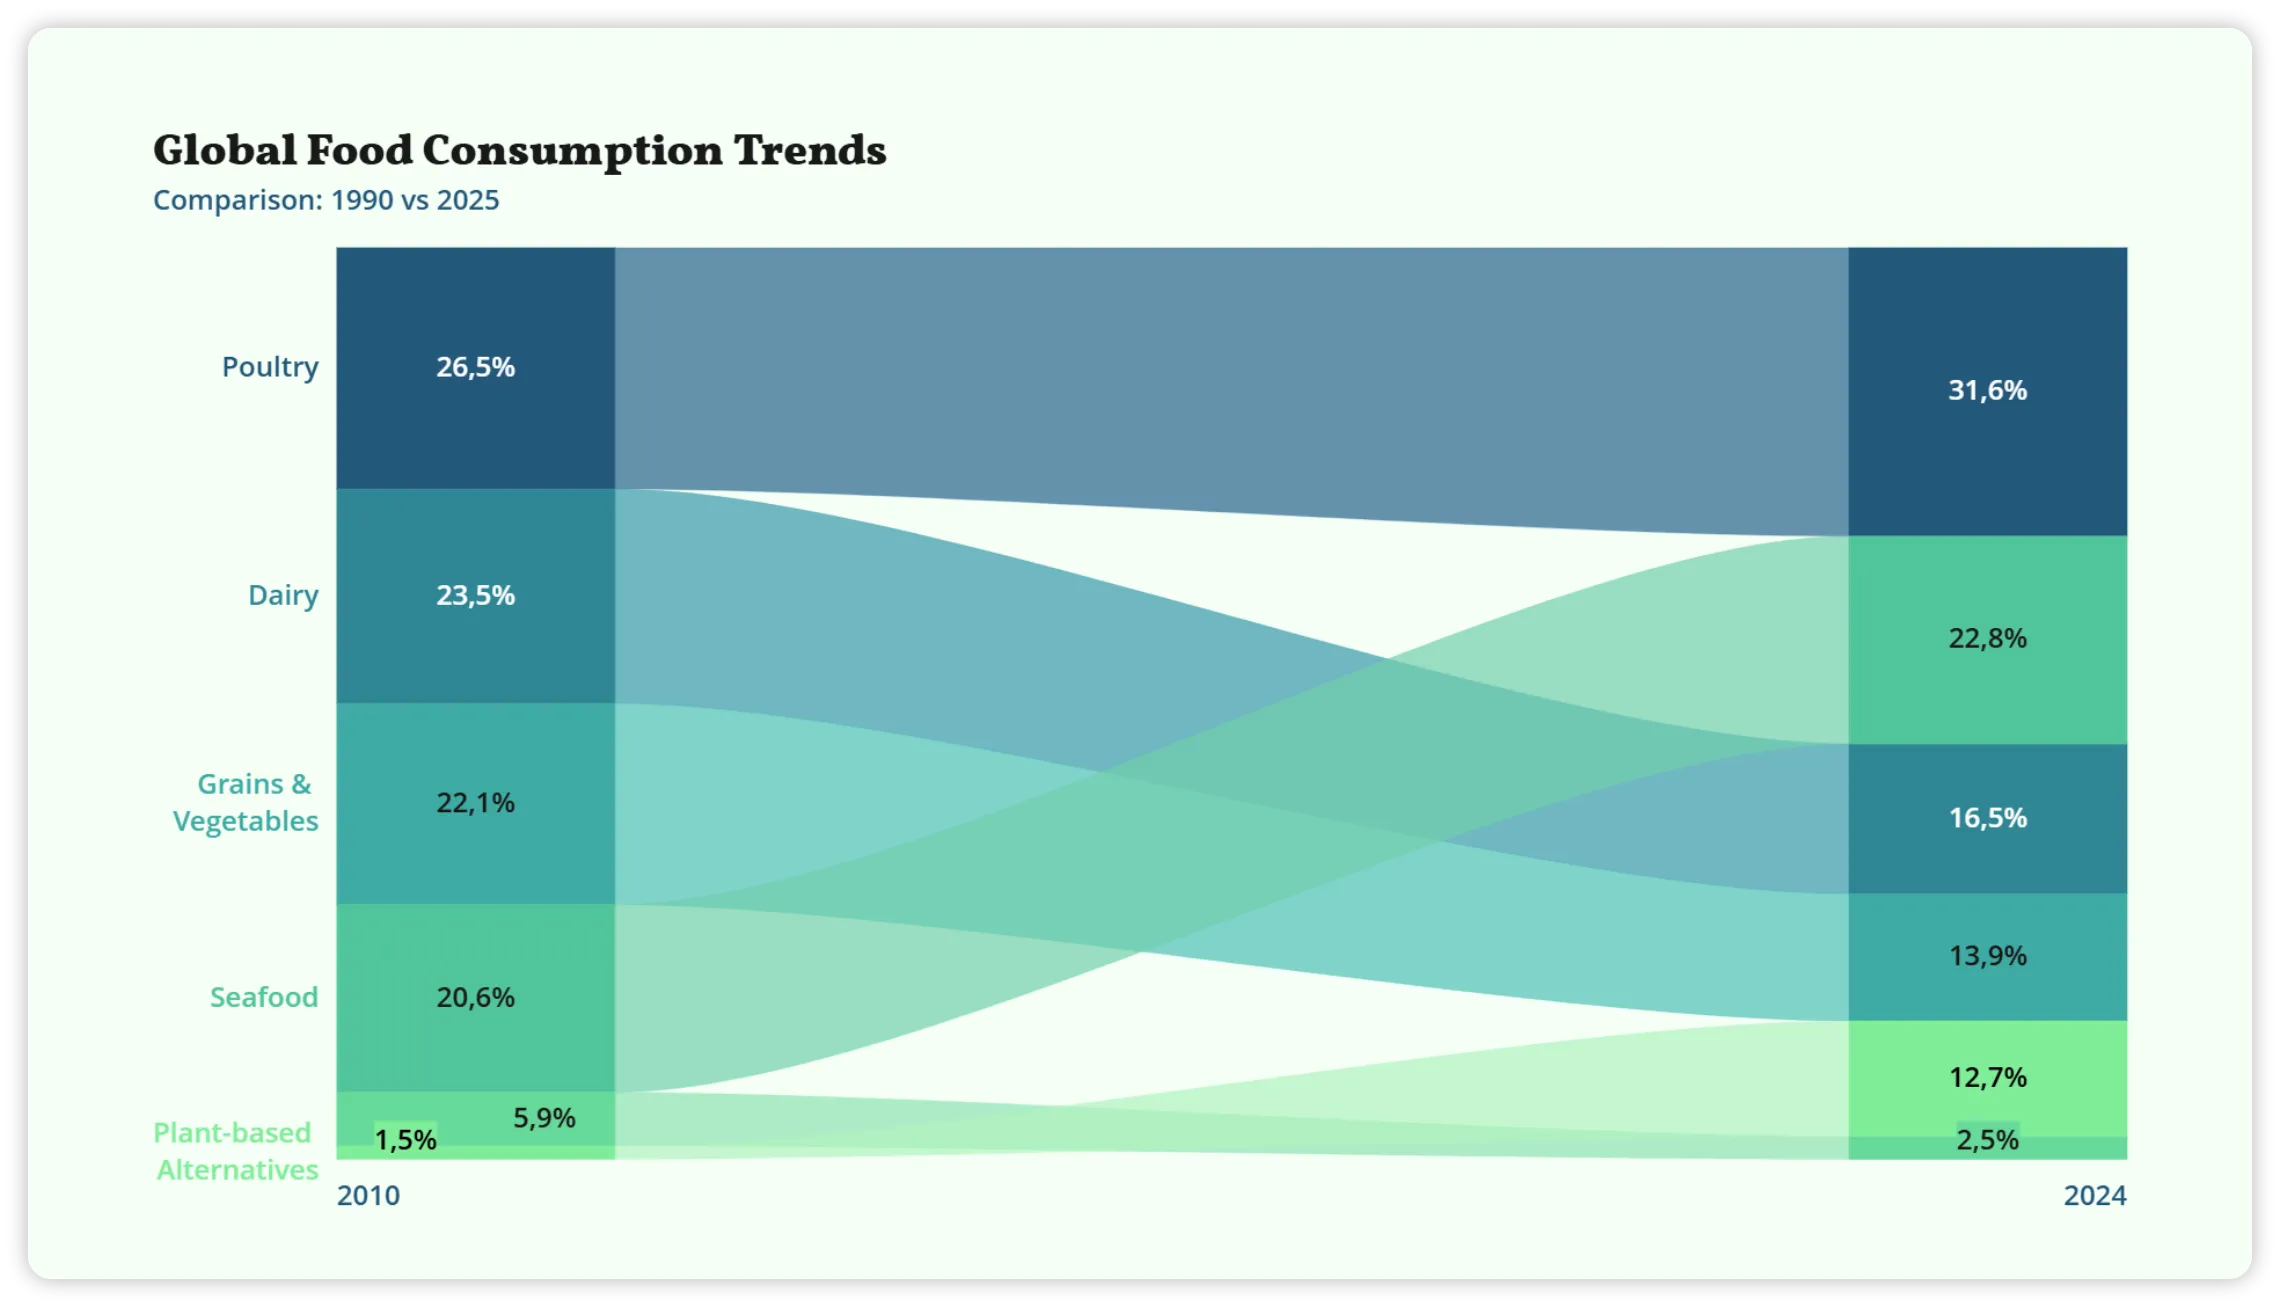
Highlight what matters
Communicate insights more clearly with visual elements that
emphasize trends, changes, and key takeaways in your data.

Always up to date
Connect charts to cloud files or public data sources and keep them updated automatically. Changes are reflected wherever your charts are used.
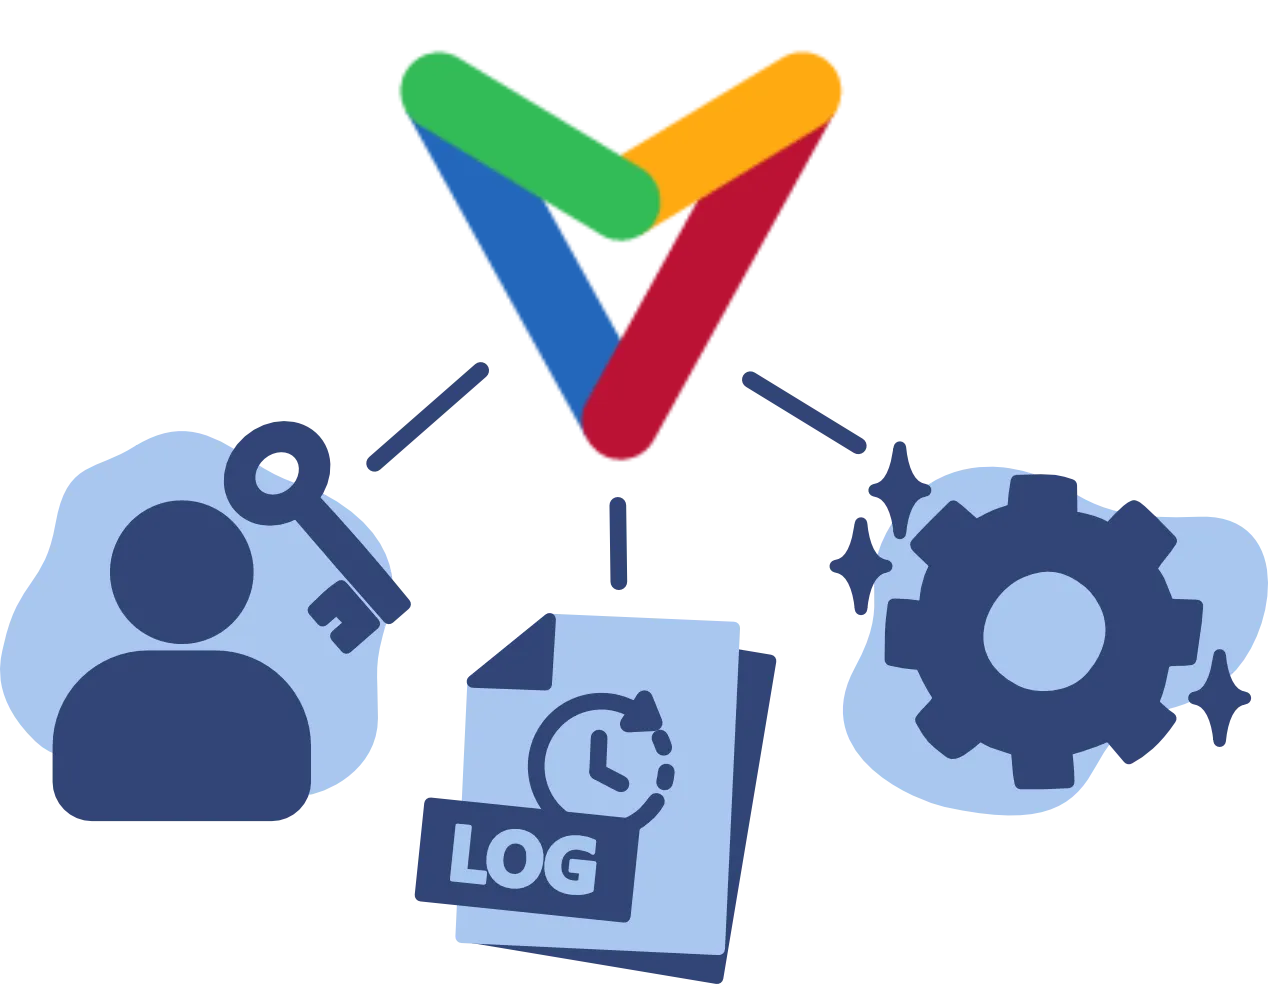
Built for enterprise
SSO, role-based access, centralized license management, and audit logs —everything you need for secure team deployment.
Enterprise details
Create charts with AI
Describe your data or goal and let Chart Vizzard generate a fully editable chart in seconds— ready to refine and customize.
Create with AI