Chart Vizzard
Vizzlo's AI-based chart generatorCreate your Long Process Diagram in seconds


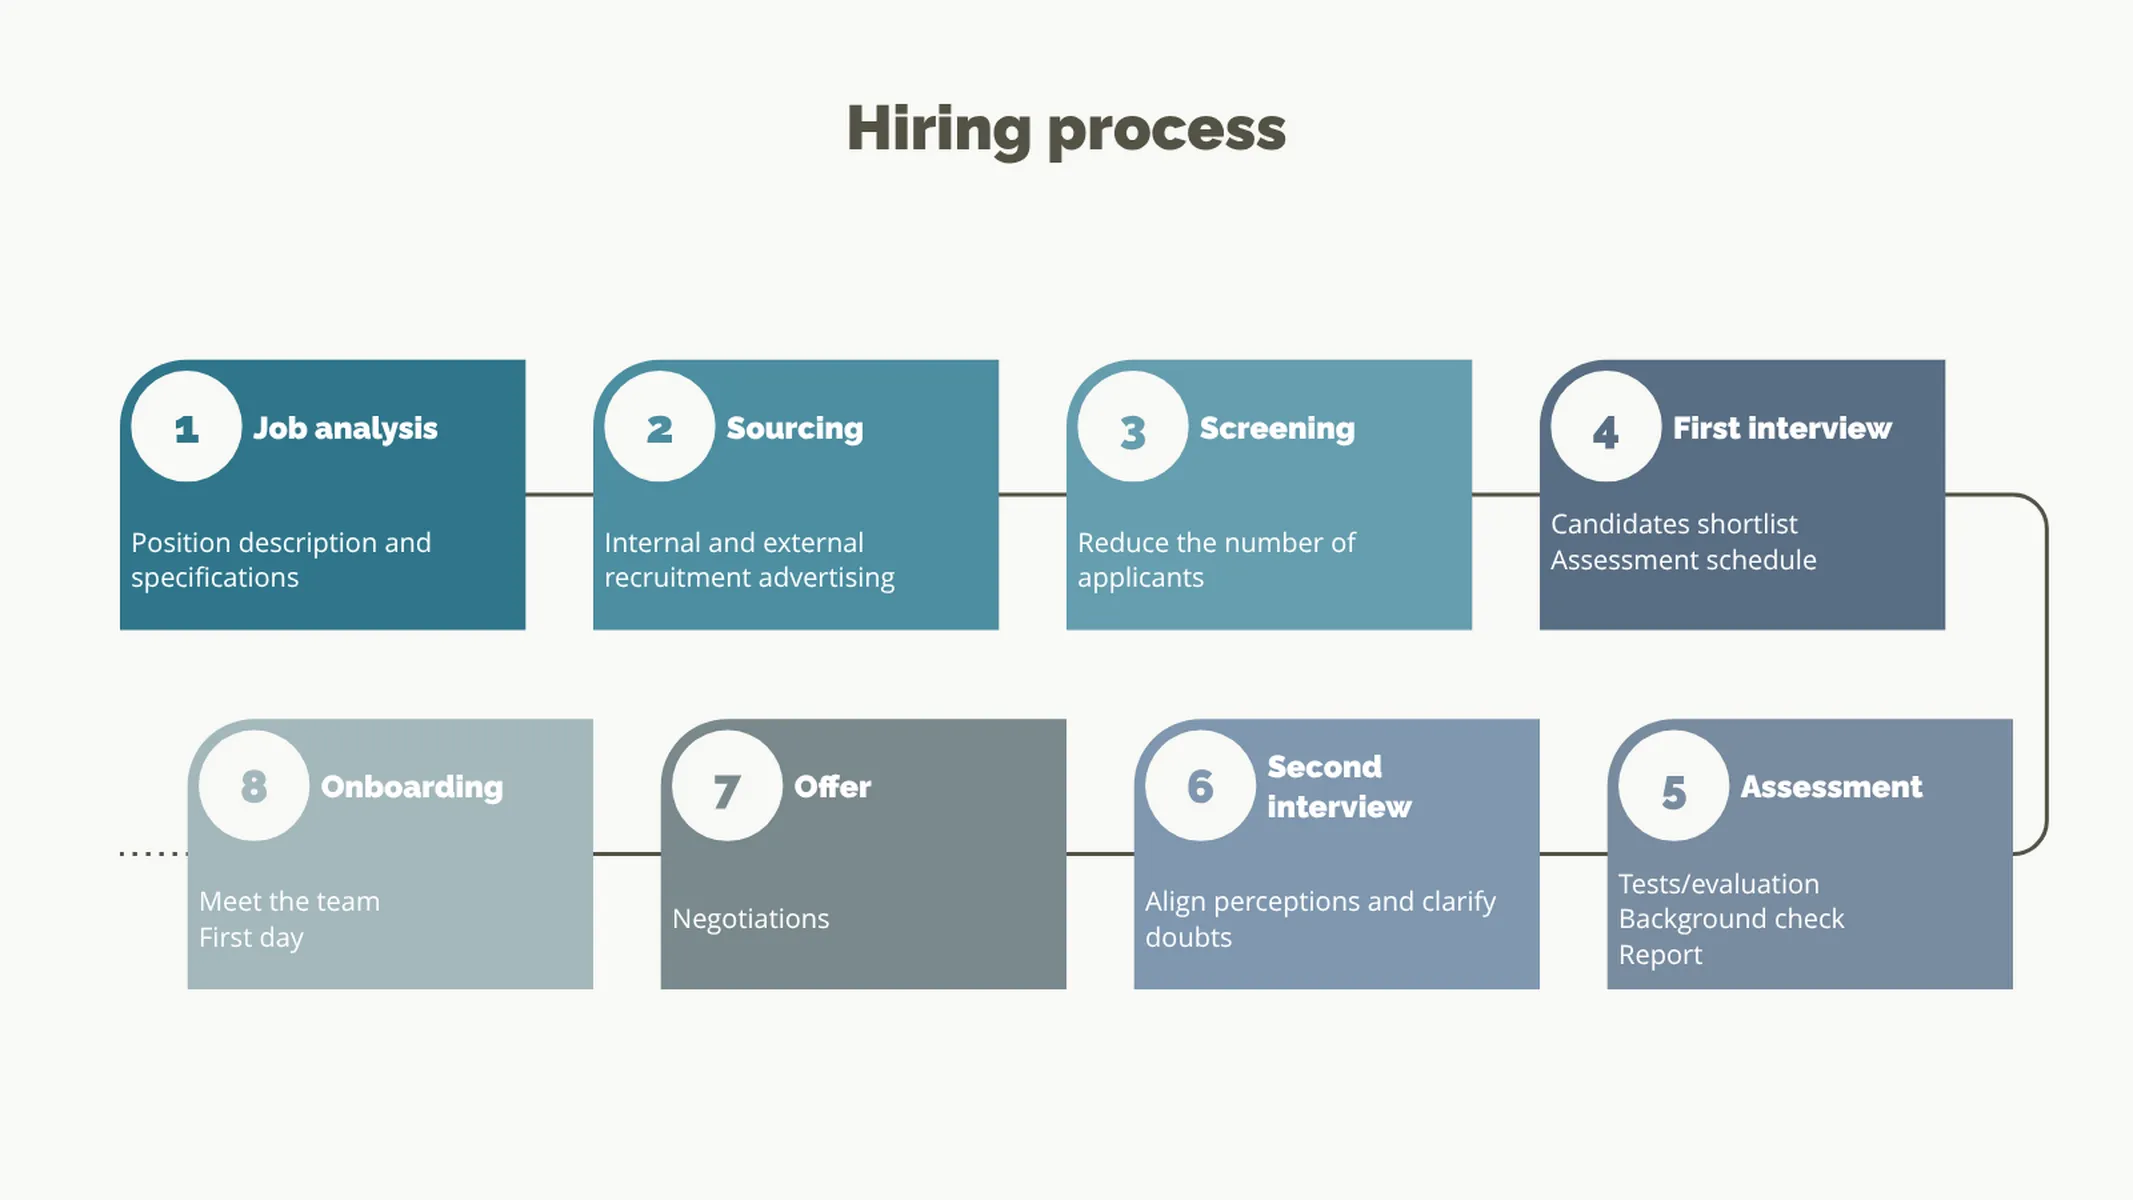
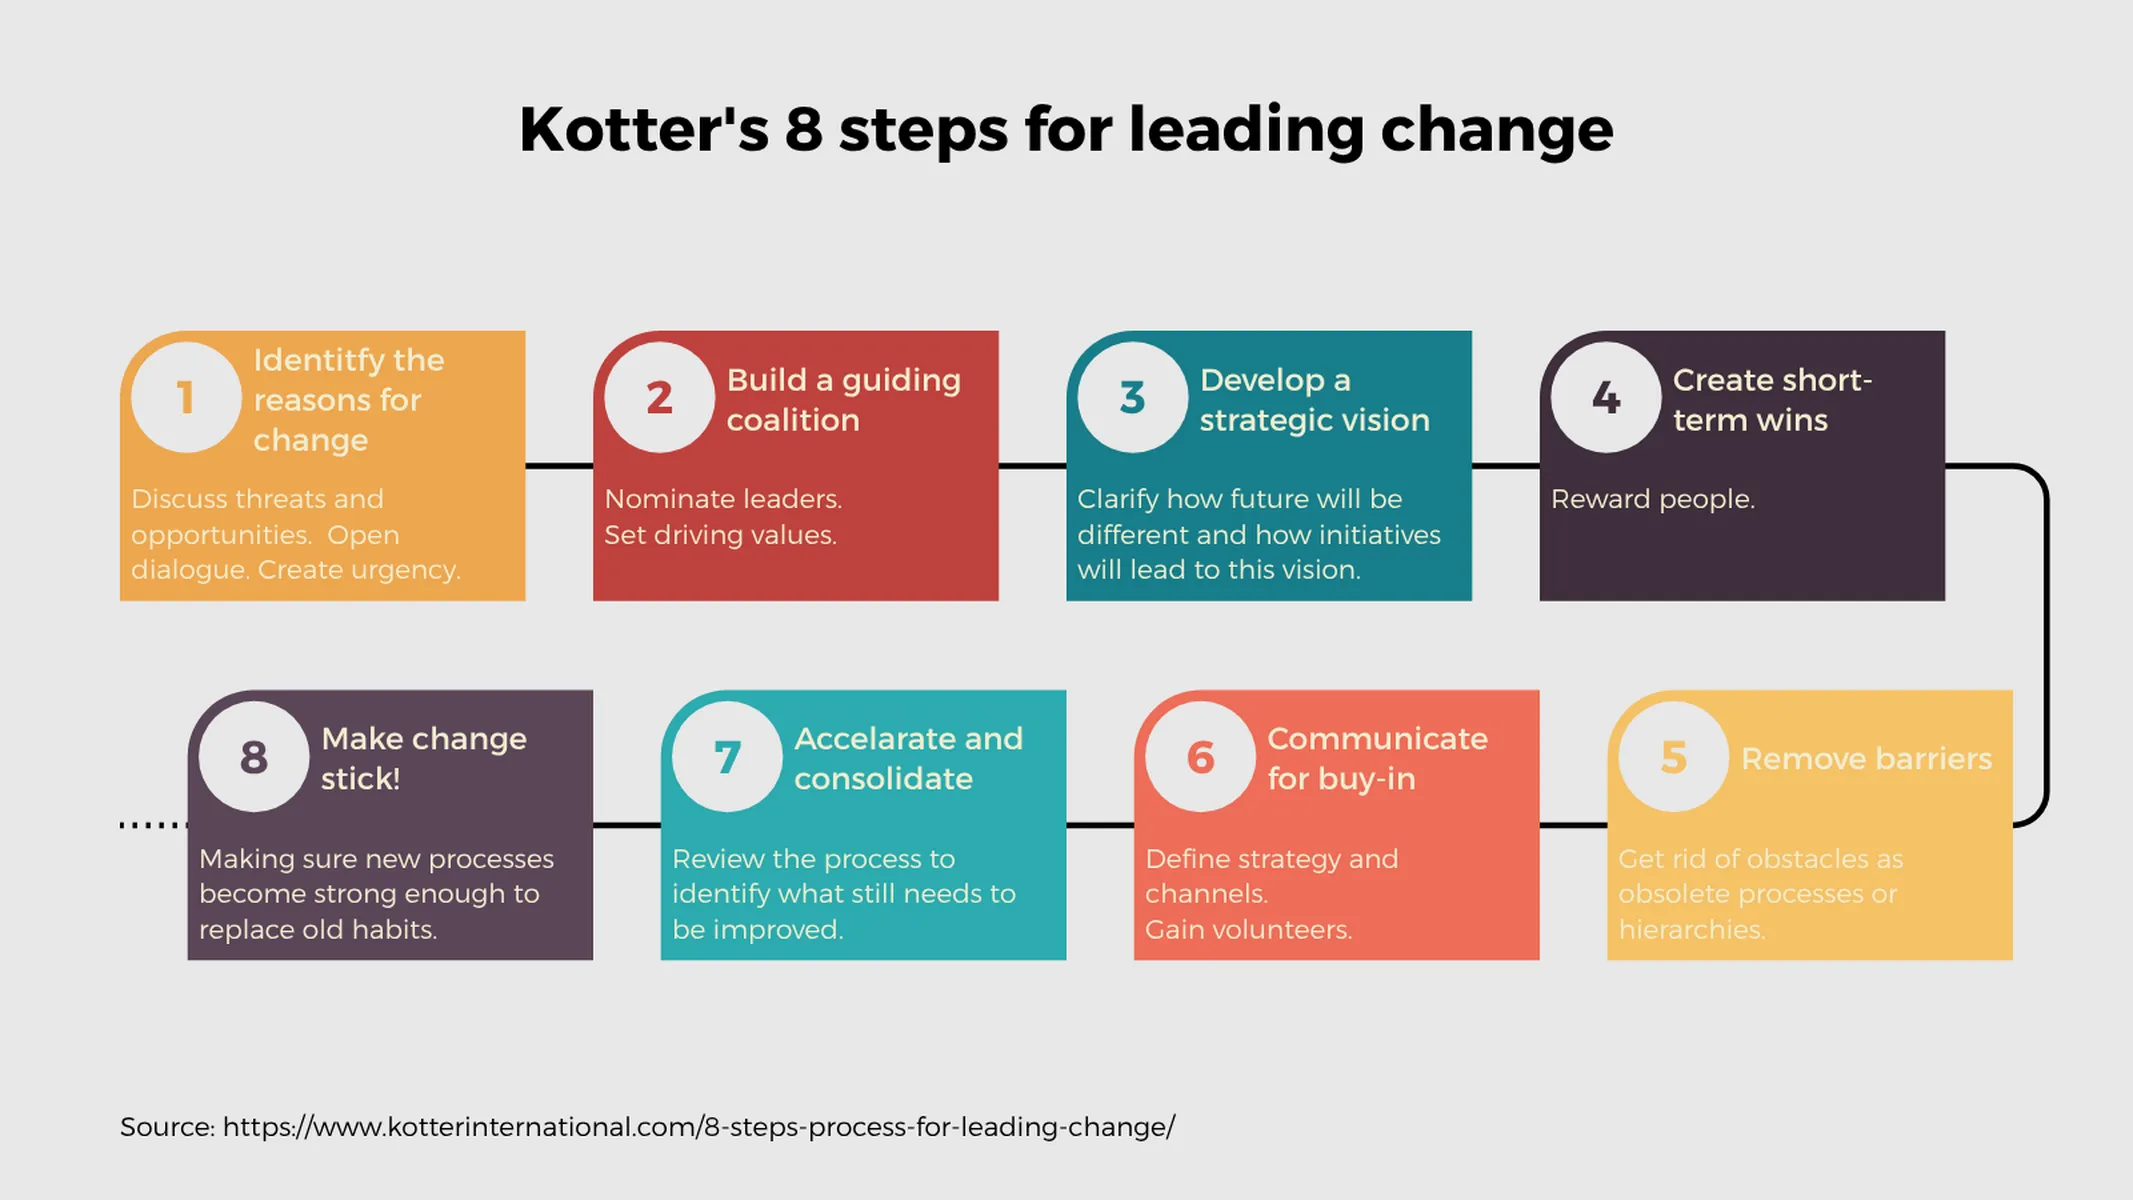
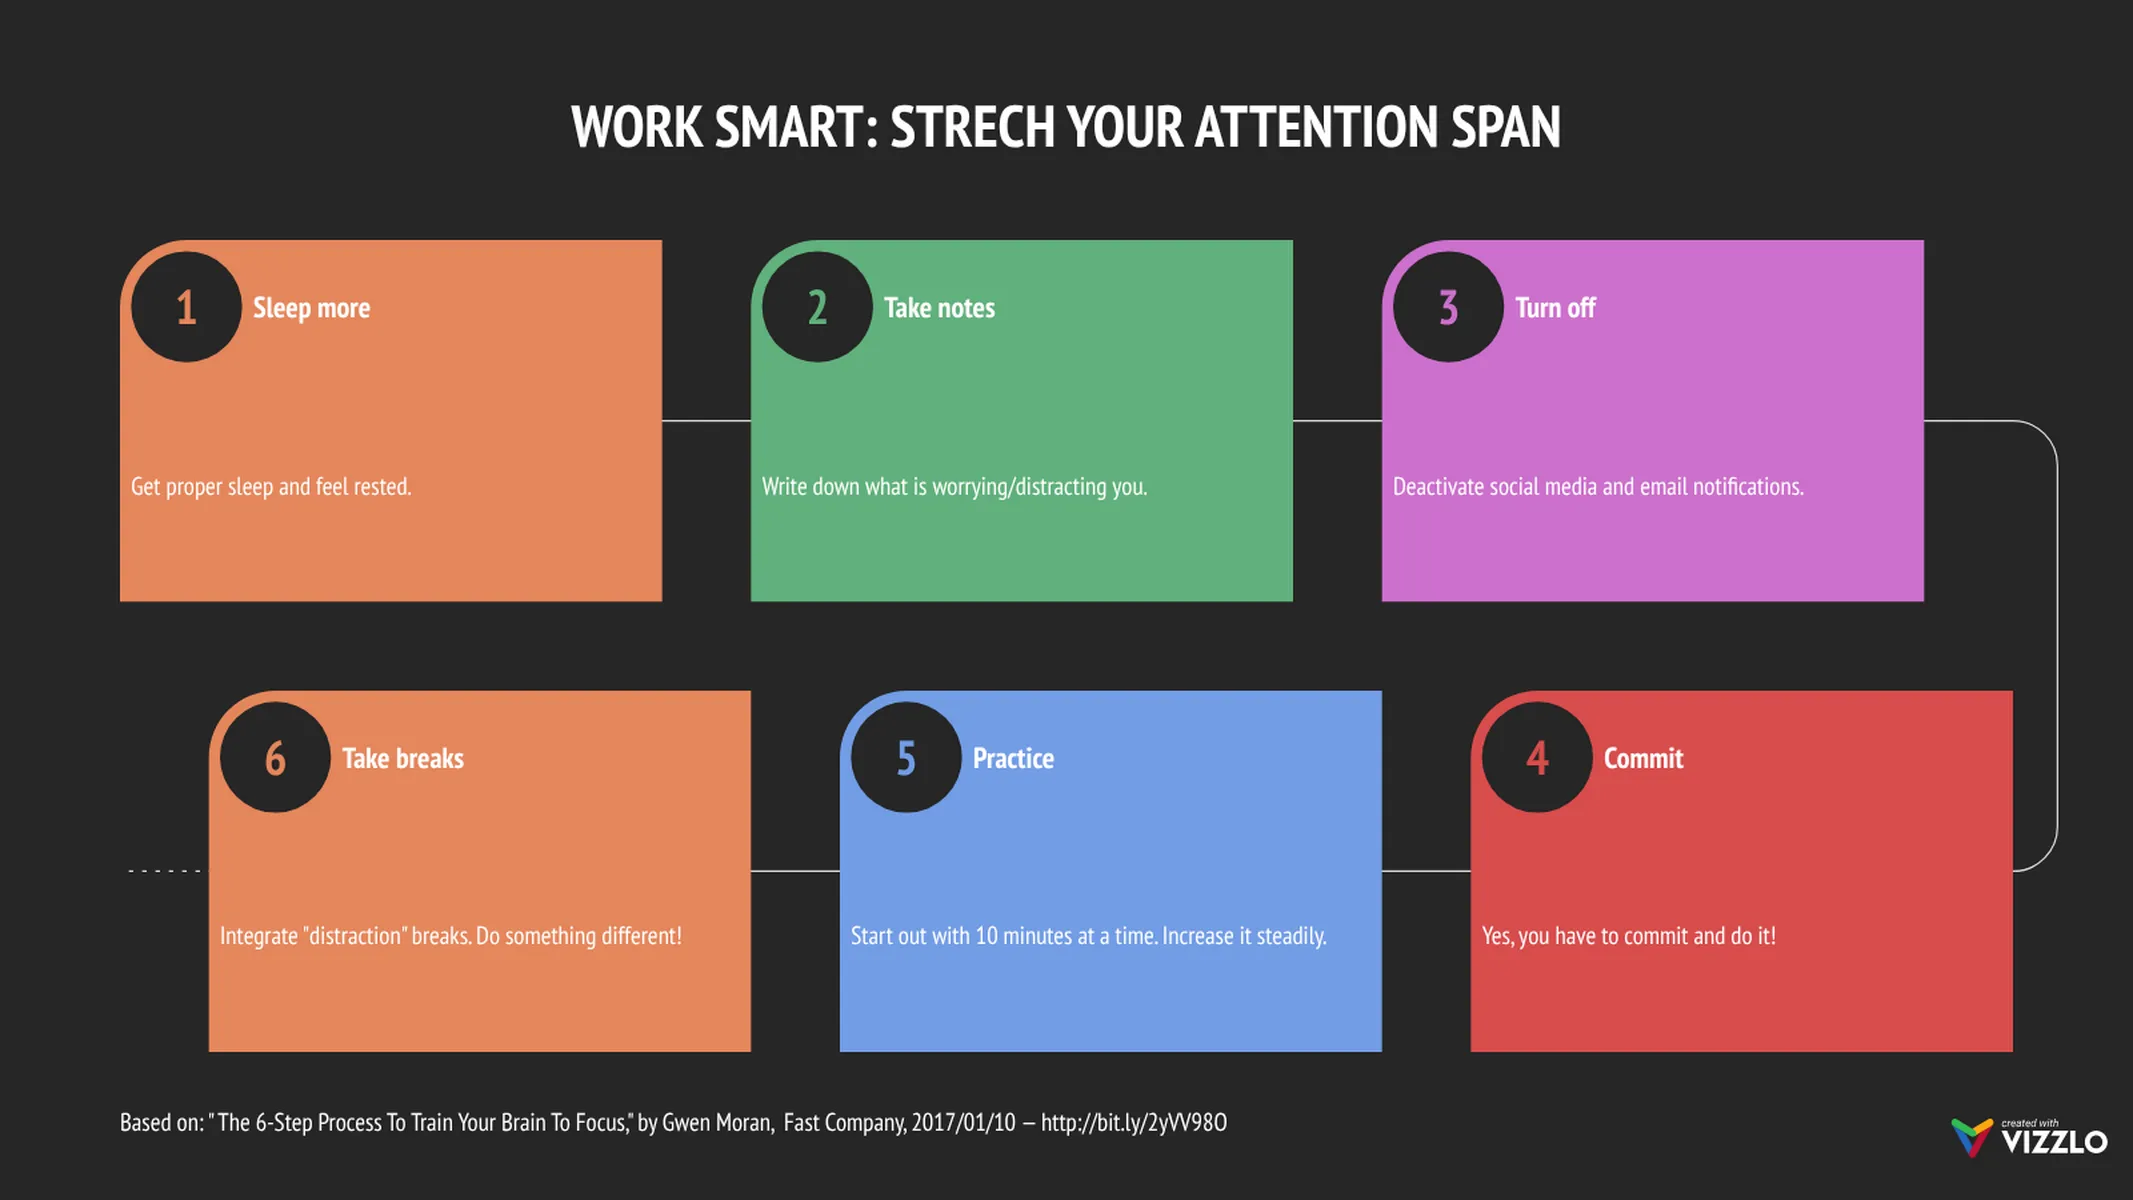
A visually attractive way to explain longer processes of a specific project or your day-to-day operations.
Create your chart in 3 simple steps
- Create new Long Process Diagram
- Add your data
- Export or share
Why Vizzlo?
- Create professional charts in seconds
- Fully customizable, no design skills needed
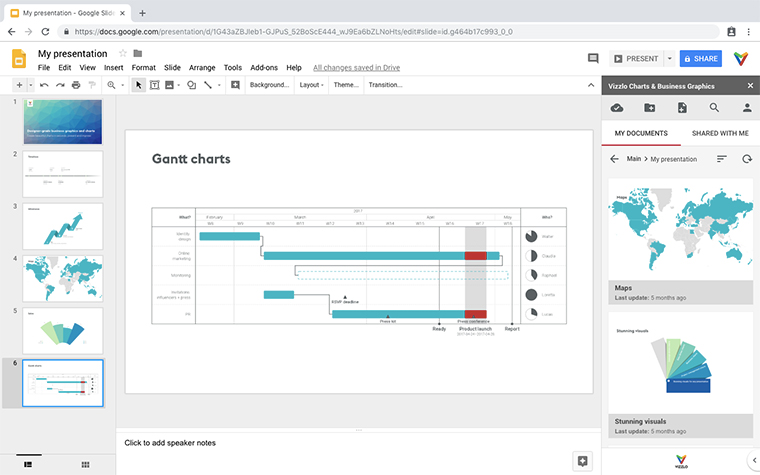
- Create directly in PowerPoint & Google Slides
What is the long process diagram?
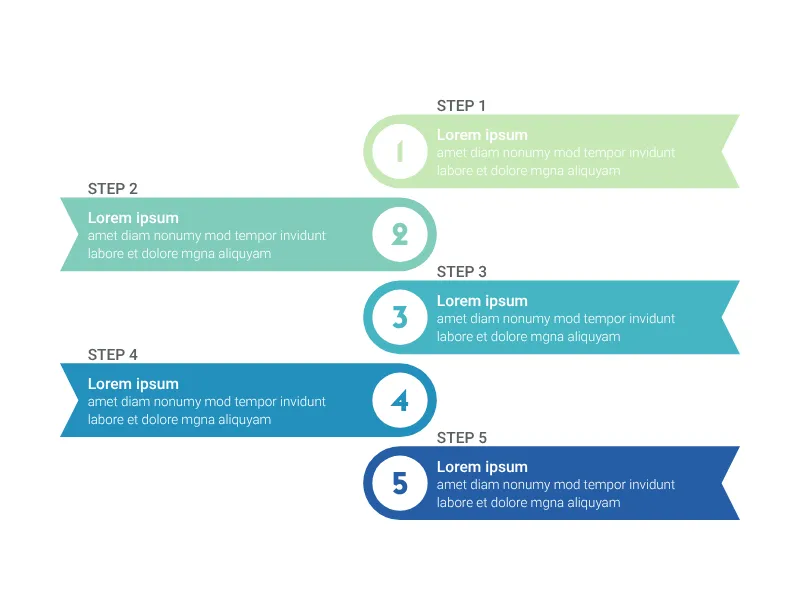
A long process diagram is a graphical representation of the multiple steps that lead to the fulfillment of a complex task.
Documenting and visualizing processes is an efficient way to formalize and communicate routines, make how-to knowledge accessible and ensure the consistency and the quality of the work to be done.
How to make a long process diagram with Vizzlo?
The Long Process diagram is very easy to create and to read. Make yours online, in just a few minutes!
- Click on any element of the chart to start editing it.
- Alternatively, use the active cards in the sidebar to enter your data and define custom colors. You might also import or copy and paste your data into Vizzlo’s spreadsheet.
- Drag and drop the shapes to reposition them.
- Explore the “APPEARANCE” tab to fine-tune the look of your chart.
Process diagram: key features
- Custom colors
- Optional enumeration
Long Process Diagram: What's new?
Long Process Diagram Alternatives
Enhance your productivity
Create a Long Process Diagram directly in the tools you love
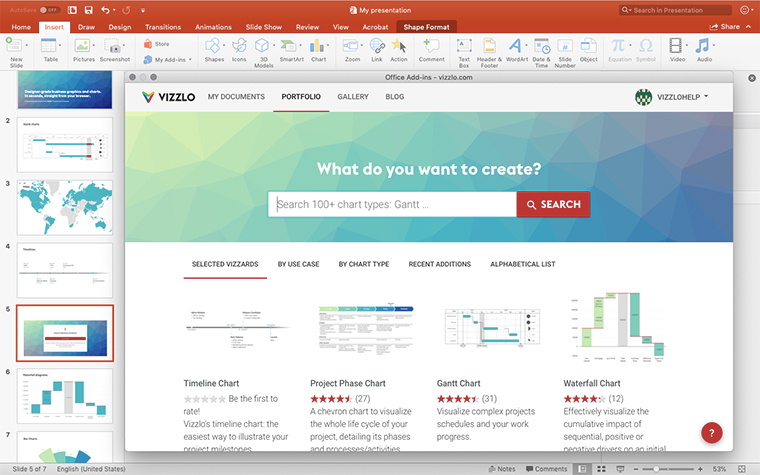
Create a Long Process Diagram in PowerPoint with
Vizzlo's add-in
Loved by professionals around the world







Visualizations your audience won’t forget
Convey abstract concepts and data with professionally designed
charts and graphics you can easily edit and customize.