PREVIEW
Chart Vizzard
Vizzlo's AI-based chart generatorU.S. Energy-related Carbon Dioxide Emissions in 2022
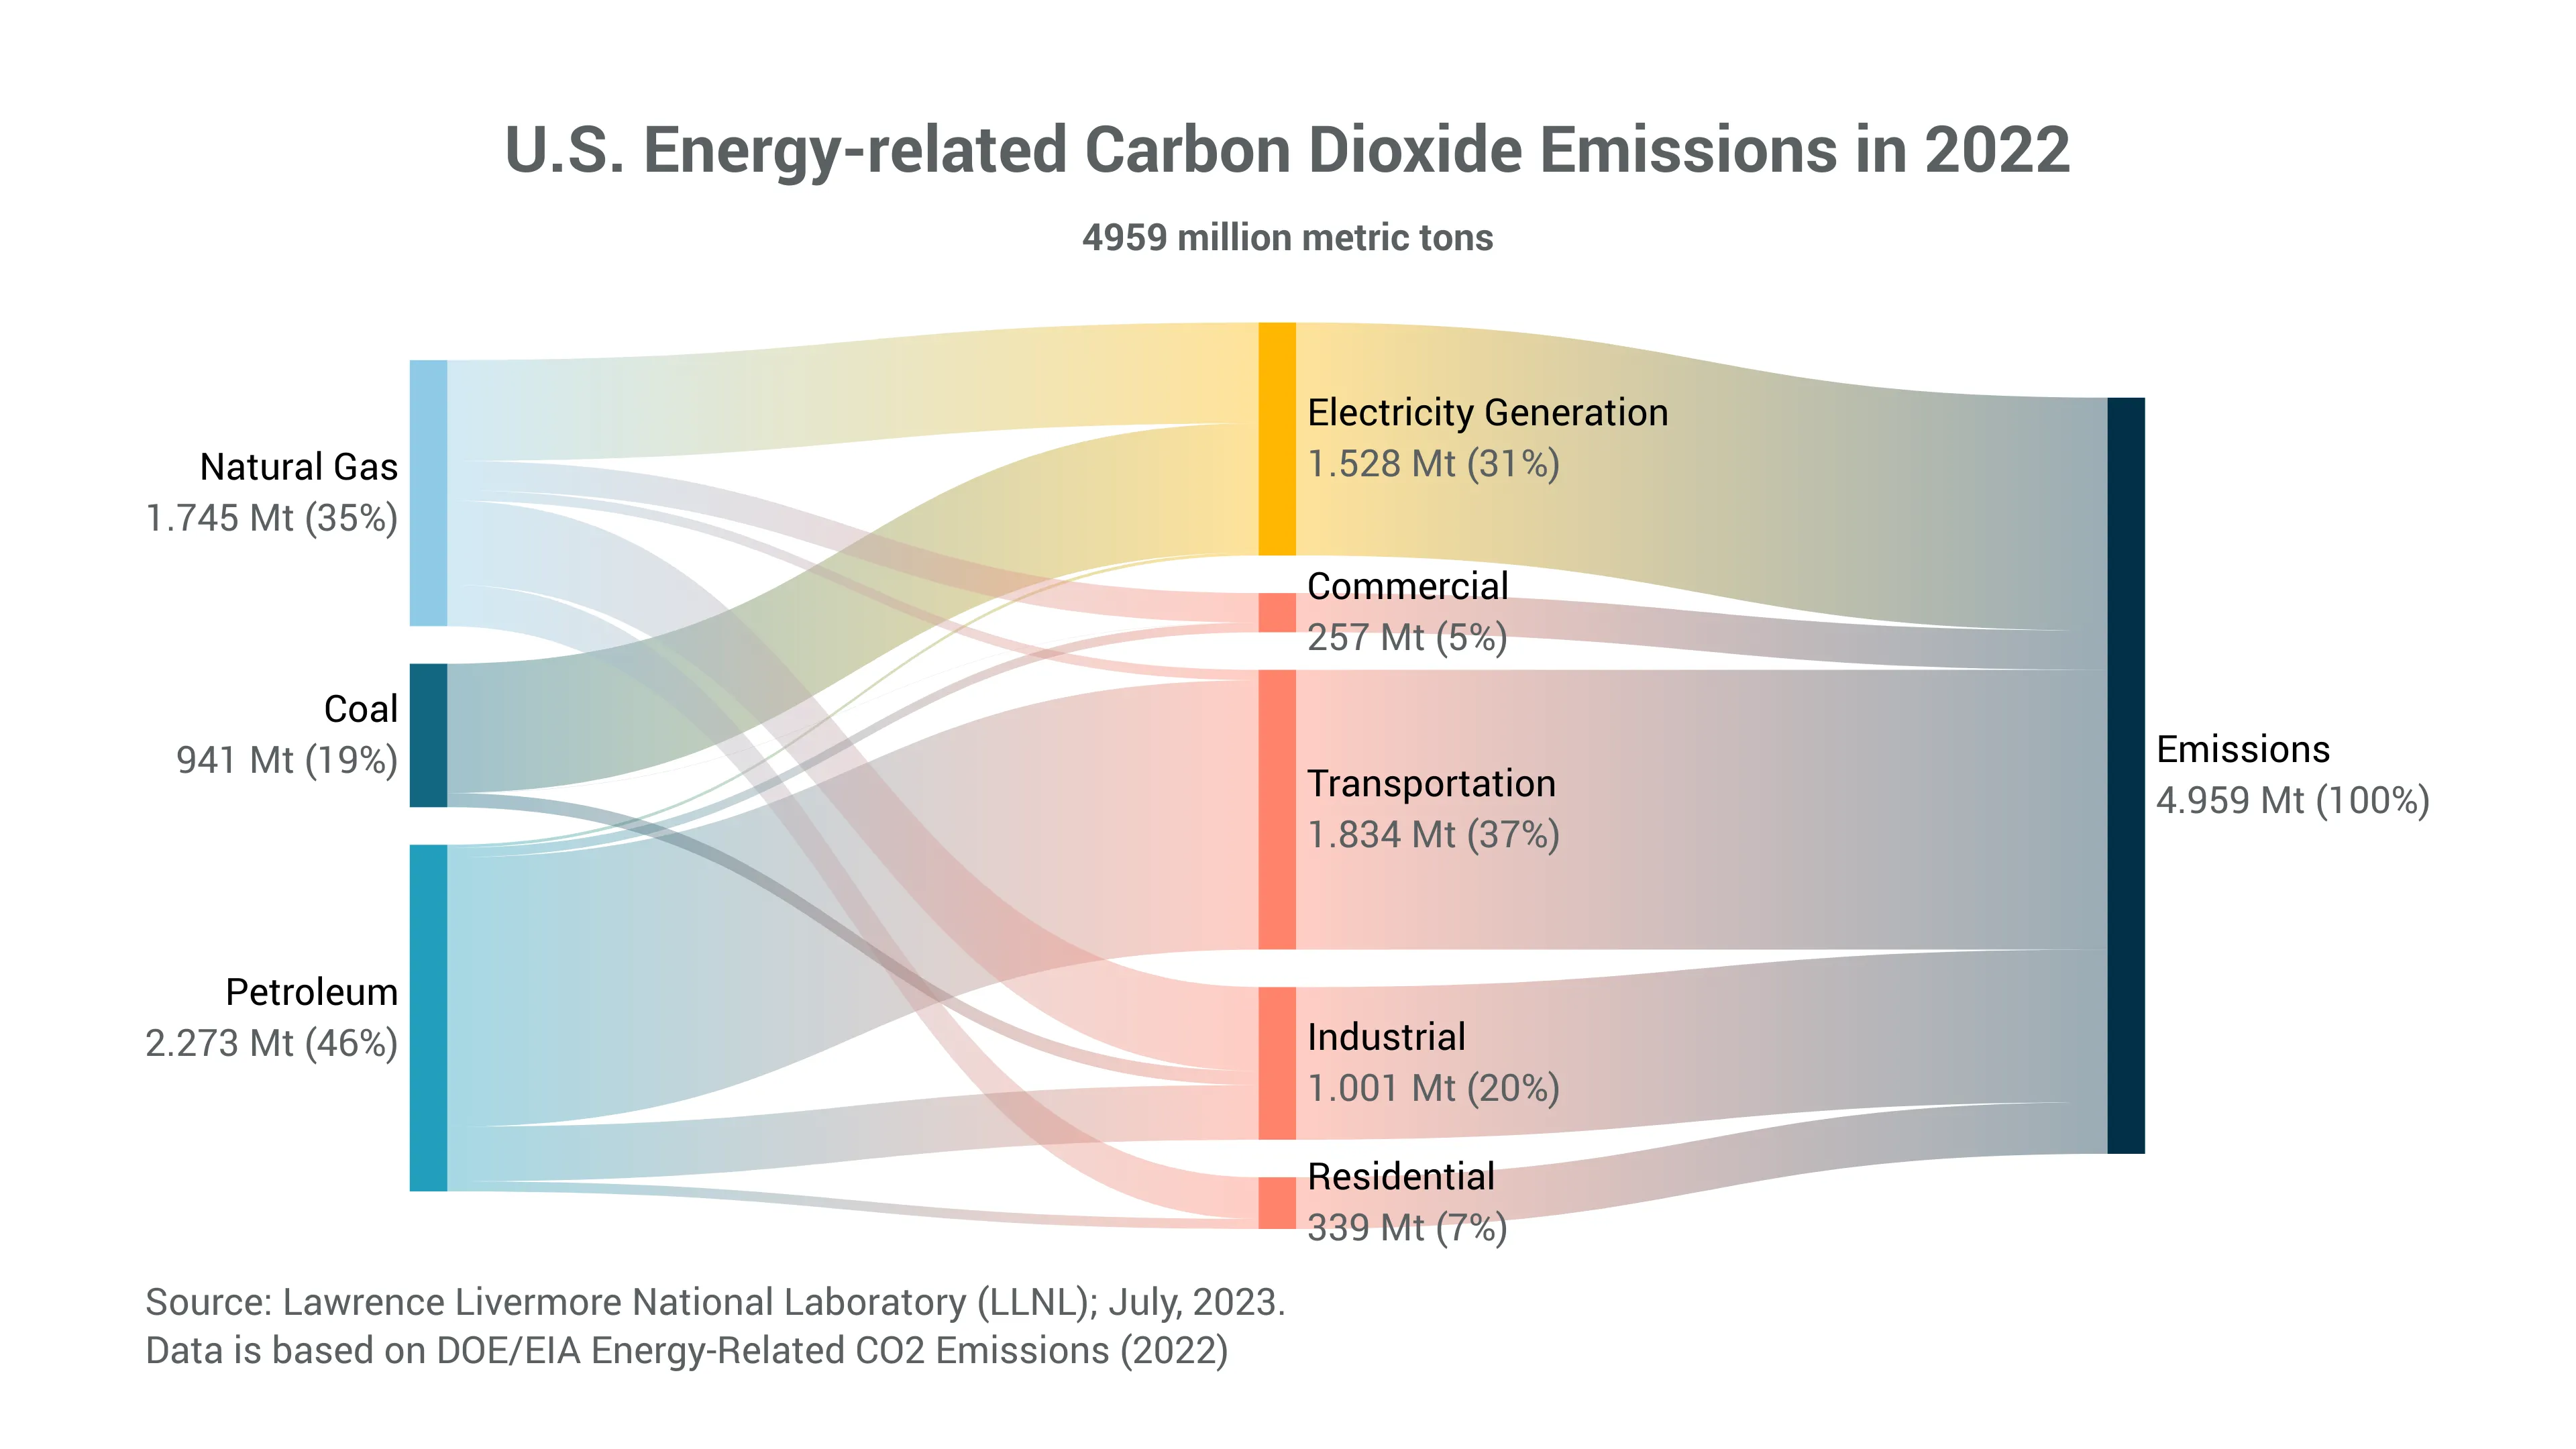
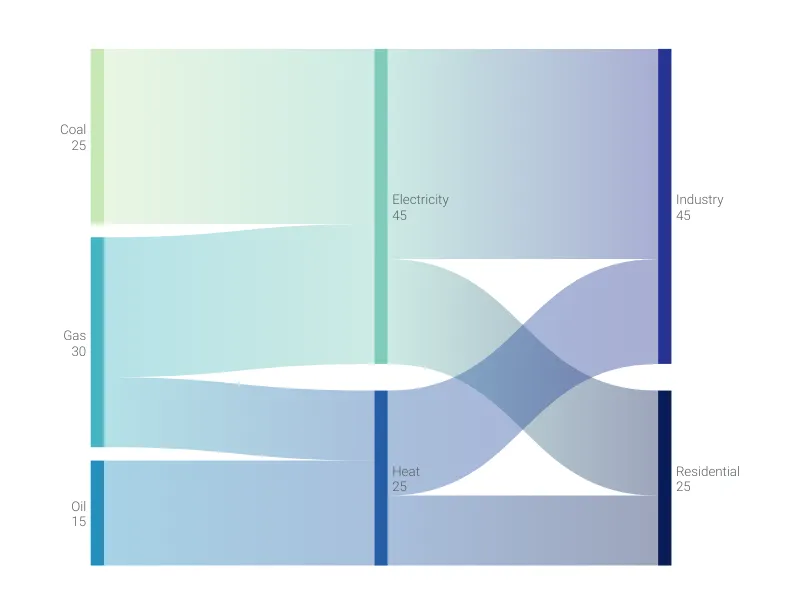
This is an example of Vizzlo's “Sankey Diagram”
Visualize flows and quantities between nodes using proportional-width bands. Perfect for energy flows, budget allocations, and process analysis.