Chart Vizzard
Vizzlo's AI-based chart generatorSankey Diagram
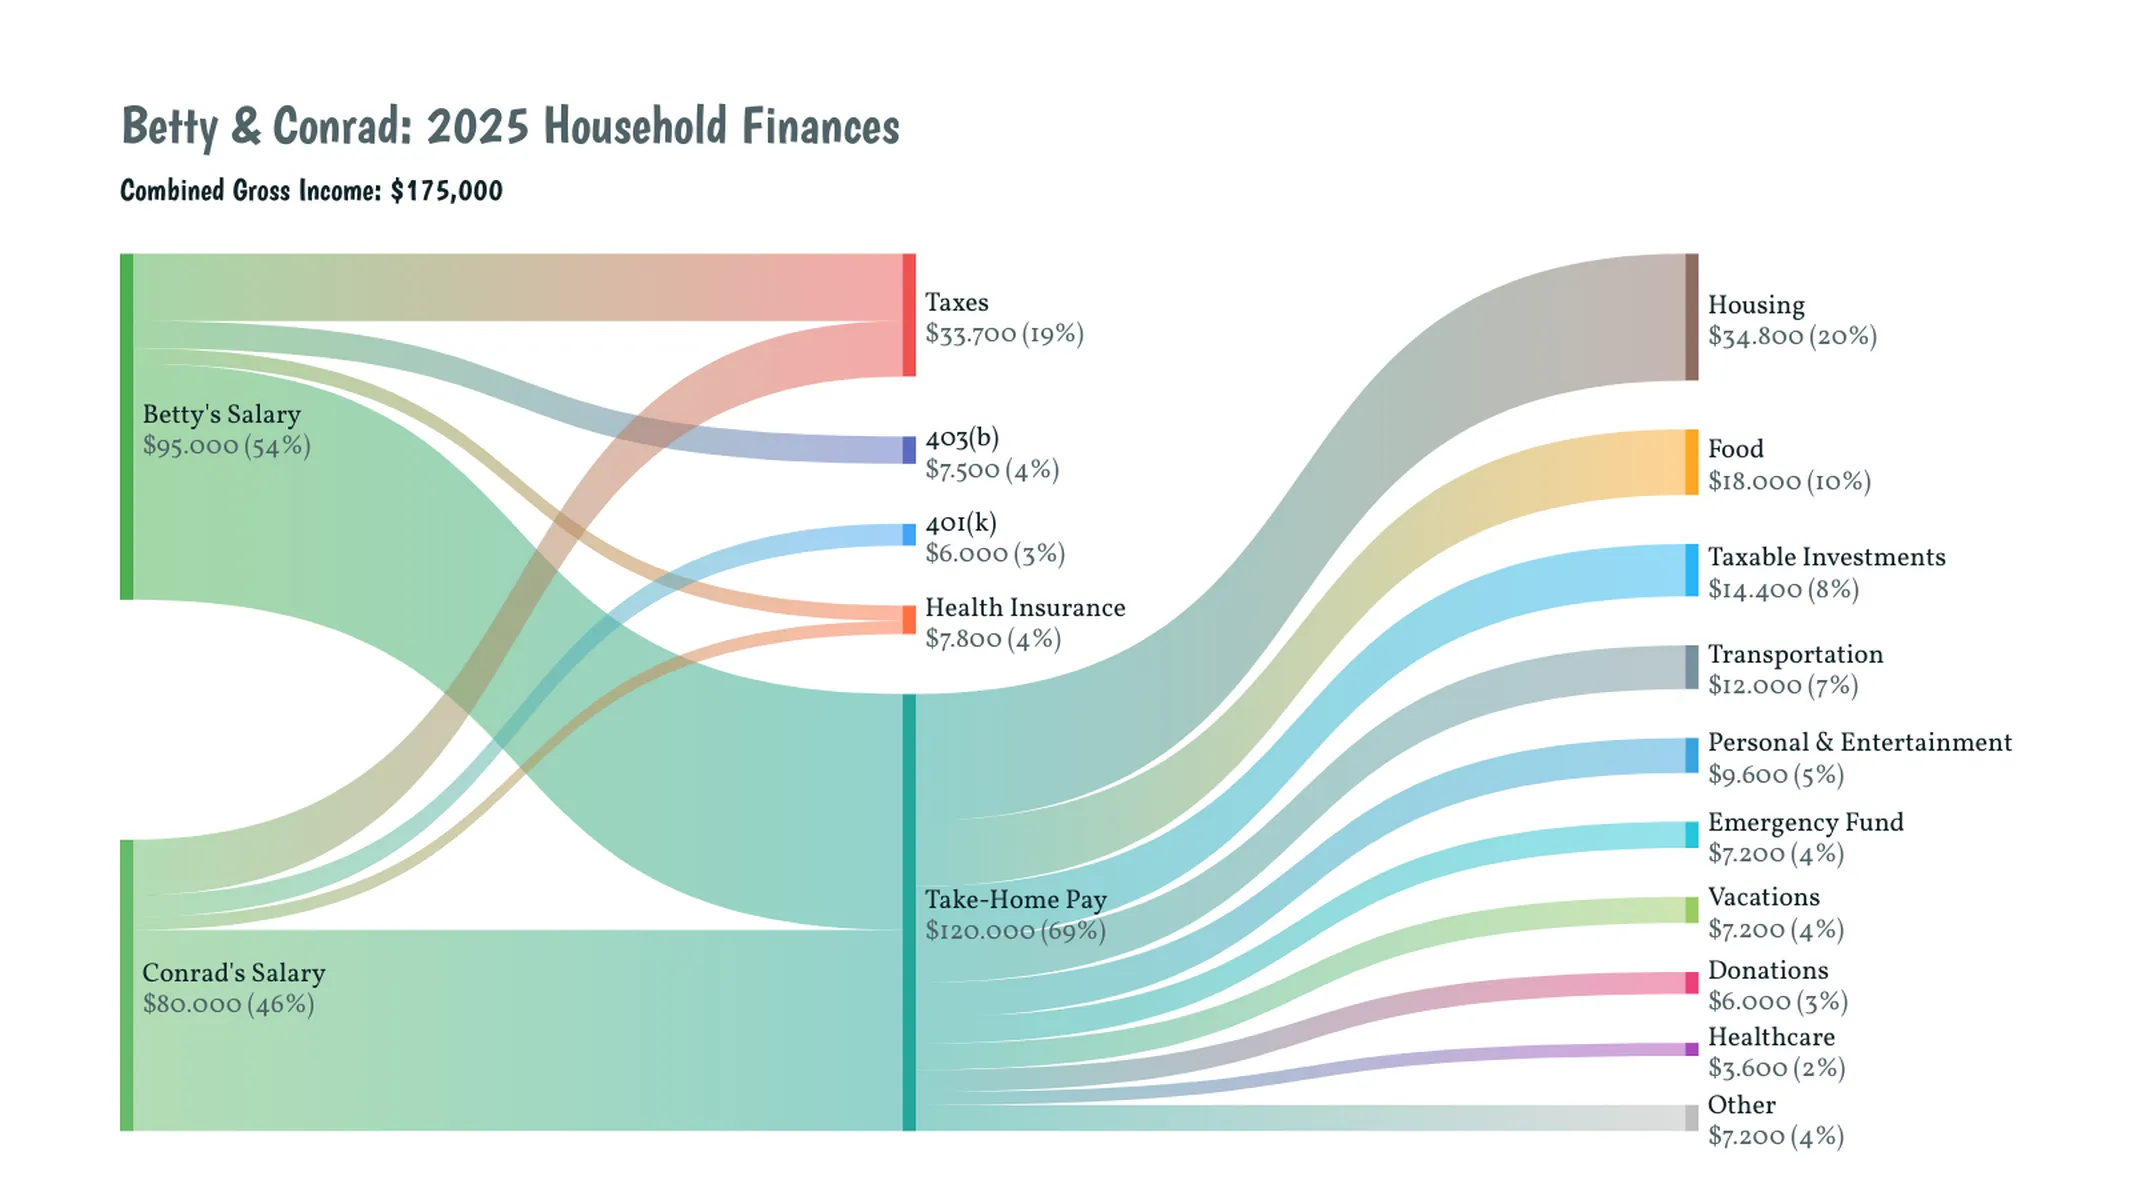
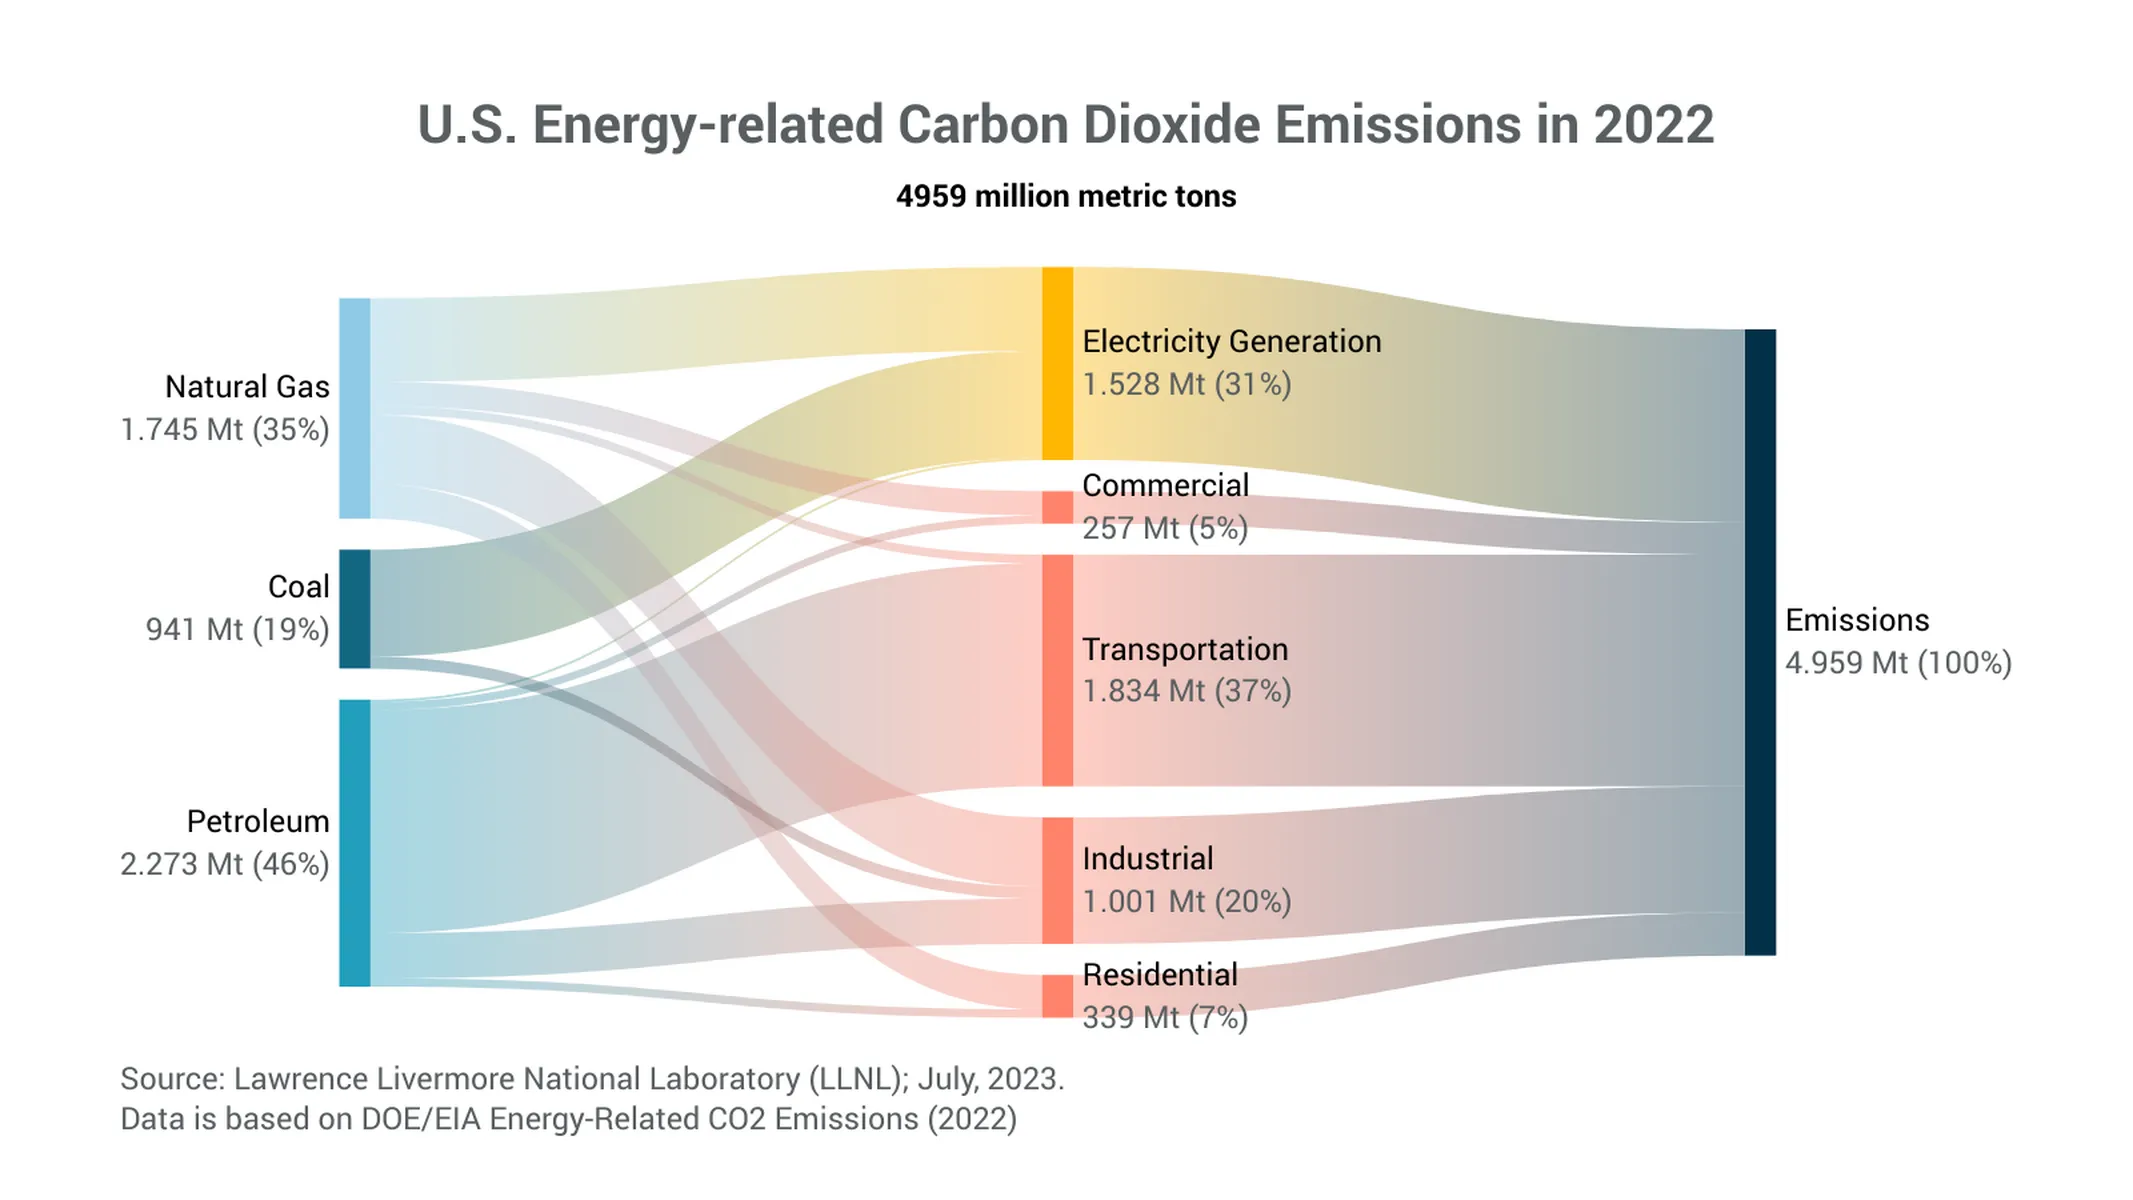
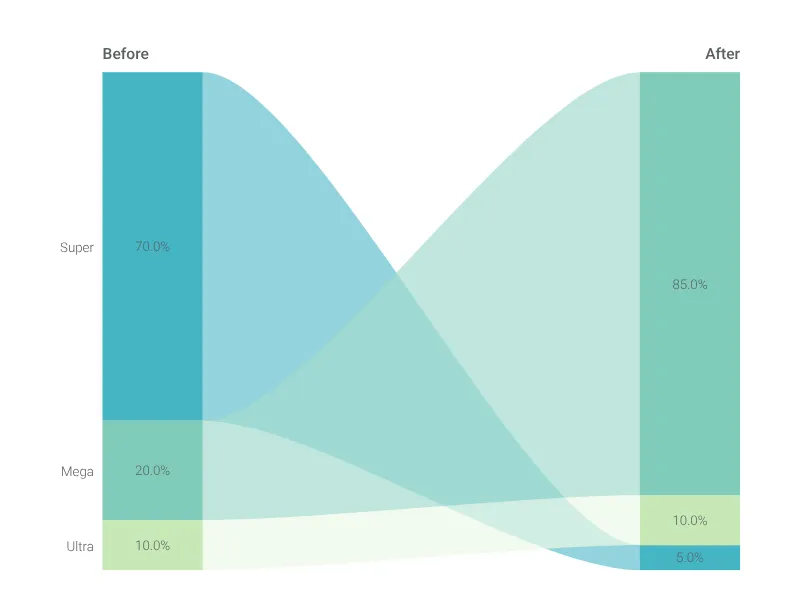
Visualize flows and quantities between nodes using proportional-width bands. Perfect for energy flows, budget allocations, and process analysis.
Features
- Horizontal or vertical layout with adjustable node alignment, width, and spacing
- Gradient or solid flow coloring with custom node colors
- Adjustable flow curvature and opacity
- Rich-text node labels with flexible label positioning
- Value labels with full number formatting
- Spreadsheet or card-based data entry
What is a Sankey diagram?
A Sankey diagram is a flow diagram in which the width of each band is proportional to the quantity it represents. Flows run from source nodes to target nodes, so the heaviest pathways stand out at a glance and you can immediately see how a quantity splits, merges, and redistributes as it moves through a system.
Named after the engineer Matthew Henry Phineas Riall Sankey, who used the technique in 1898 to depict the energy efficiency of a steam engine, the chart excels wherever a conserved quantity travels through multiple stages: energy and material flows, budget allocations, supply chains, website traffic paths, customer journeys, or any multi-step process.
How to make a Sankey diagram with Vizzlo?
- Enter your flows in the spreadsheet or with the cards in the sidebar — each row links a source node to a target node with a value.
- Click any node or label directly on the canvas to rename or recolor it.
- Switch between a horizontal and a vertical layout, and fine-tune node alignment, width, and spacing in the sidebar.
- Choose gradient or solid flow coloring, then adjust flow curvature and opacity to match your style.
- Set your preferred number format and pick a color theme to finish.
Sankey Diagram: What's new?
Sankey Diagram Alternatives
Use Cases
Process & Structure diagramsEnhance your productivity
Create a Sankey Diagram directly in the tools you love
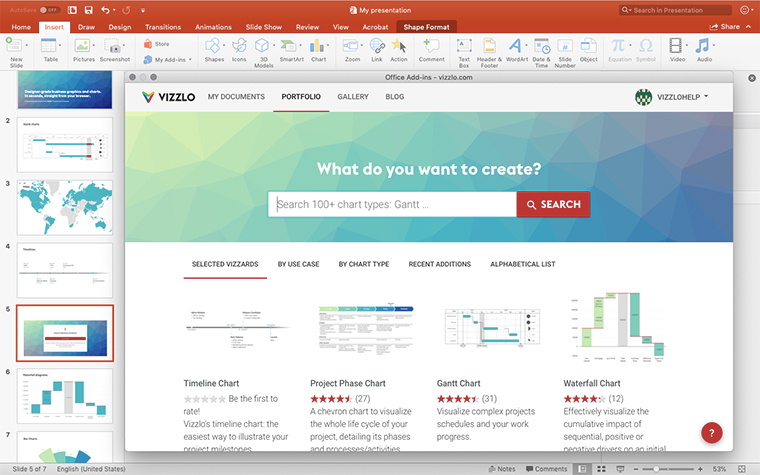
Create a Sankey Diagram in PowerPoint with
Vizzlo's add-in
Loved by professionals around the world


Visualizations your audience won’t forget
Convey abstract concepts and data with professionally designed
charts and graphics you can easily edit and customize.