Chart Vizzard
Vizzlo's AI-based chart generatorTimeline of Love
Valentine's Day special: A timeline for lovers.
What is a timeline of love?
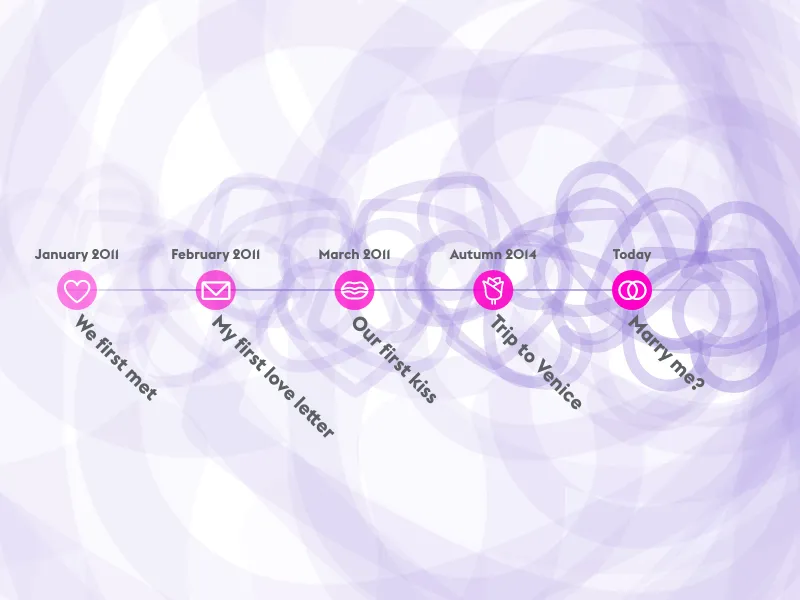
The Timeline of Love brings romance and emotional connection to data visualization through a beautifully designed timeline perfect for celebrating relationships, personal milestones, or any journey that deserves a touch of heart. This Valentine’s Day-inspired visualization combines chronological storytelling with romantic visual elements.
Key Features
- Romantic timeline design: Beautiful, love-themed visualization for special occasions
- Customizable romance: Full color control for background and milestone elements
- Iconic symbols: Six romantic icons including hearts, letters, lips, rings, roses, and thunder
- Heartiness control: Adjustable background heart decoration (0-10 hearts)
- Typography scaling: Font size control for optimal readability and impact
- Milestone storytelling: Support for up to 20 meaningful moments in your story
Best Use Cases
- Relationship timelines: Chronicle the journey of romantic relationships
- Anniversary presentations: Celebrate relationship milestones and special moments
- Wedding planning: Document engagement and wedding preparation journey
- Personal storytelling: Share meaningful life events with emotional context
- Family histories: Create touching family milestone documentation
- Friendship chronicles: Celebrate long-term friendships and shared experiences
- Achievement celebrations: Personal accomplishments with emotional significance
Configuration Options
Personalize your love timeline with romantic customization:
- Background color: Full color picker for personalized theming
- Milestone color: Custom color for timeline markers and romantic elements
- Background heartiness: Slider control (0-10) for decorative heart density
- Font size scaling: Adjustable typography (70-250%) for optimal presentation
Romantic Icon Library
Choose from six meaningful symbols:
- Heart: Classic love symbol for emotional milestones
- Letter: Love letters, communication, or written declarations
- Lips: First kisses, romantic moments, or intimate connections
- Rings: Engagements, marriages, or commitment ceremonies
- Rose: Romantic gestures, special gifts, or beautiful moments
- Thunder: Love at first sight, dramatic moments, or passionate encounters
Emotional Design Philosophy
The Timeline of Love creates powerful emotional connections through:
- Visual romance: Beautiful design elements that evoke feelings of love and connection
- Symbolic meaning: Icons that carry deep emotional and cultural significance
- Personal customization: Colors and styling that reflect individual relationship characteristics
- Narrative flow: Chronological storytelling that builds emotional engagement
Special Occasion Applications
Perfect for various romantic and personal celebrations:
- Valentine’s Day: Express love through visual storytelling
- Anniversaries: Commemorate relationship milestones with style
- Wedding ceremonies: Display relationship journey for wedding guests
- Proposal presentations: Create memorable backdrop for marriage proposals
- Gift presentations: Unique, personalized gift for loved ones
Presentation Strategies
Effective use typically includes:
- Chronological progression: Start with early relationship moments
- Milestone variety: Mix different types of romantic and relationship events
- Visual balance: Distribute different icons throughout the timeline
- Personal significance: Include moments that are meaningful to your specific relationship
The Timeline of Love transforms ordinary chronological data into emotionally resonant visual stories that celebrate the beauty and significance of human relationships and personal journeys.
Timeline of Love: What's new?
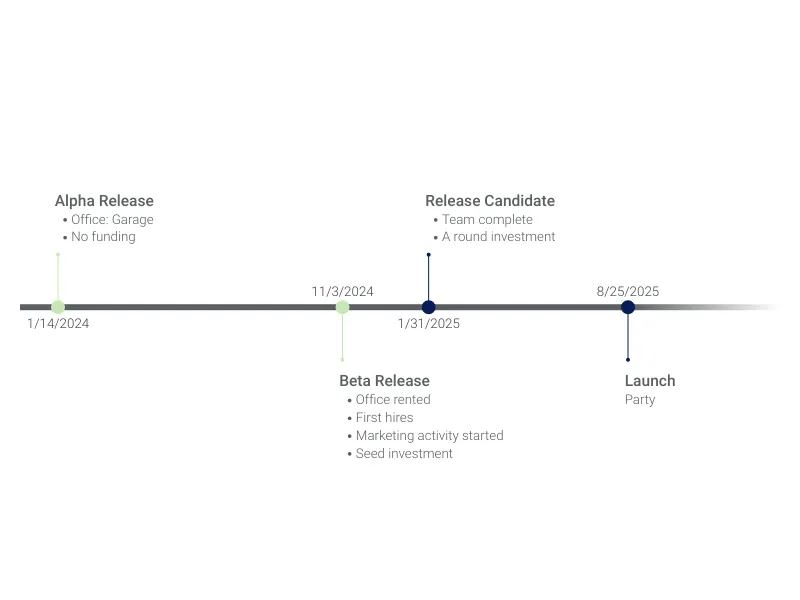
Timeline of Love Alternatives
Use Cases
Pictorial chartsEnhance your productivity
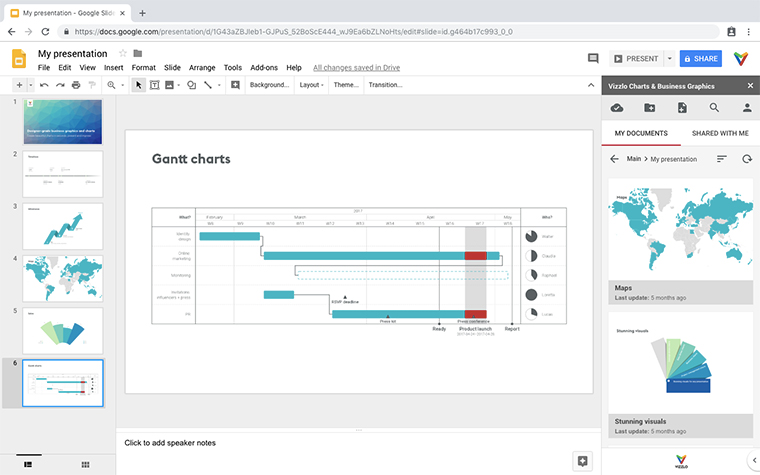
Create a Timeline of Love directly in the tools you love
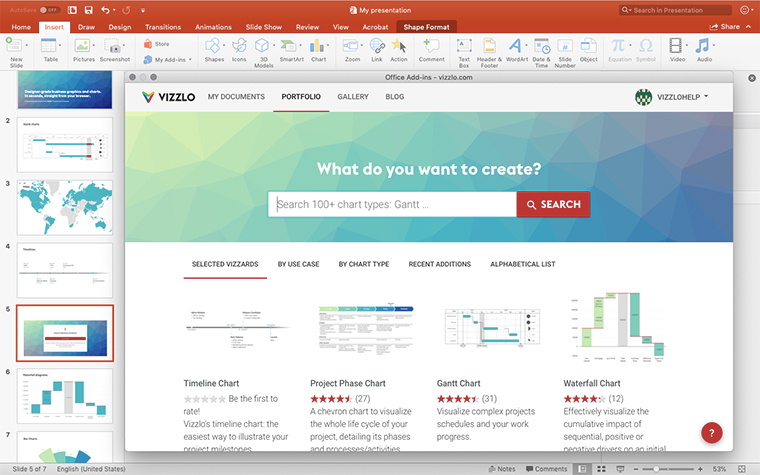
Create a Timeline of Love in PowerPoint with
Vizzlo's add-in
Loved by professionals around the world


Visualizations your audience won’t forget
Convey abstract concepts and data with professionally designed
charts and graphics you can easily edit and customize.