Chart Vizzard
Vizzlo's AI-based chart generatorLeaf Chart
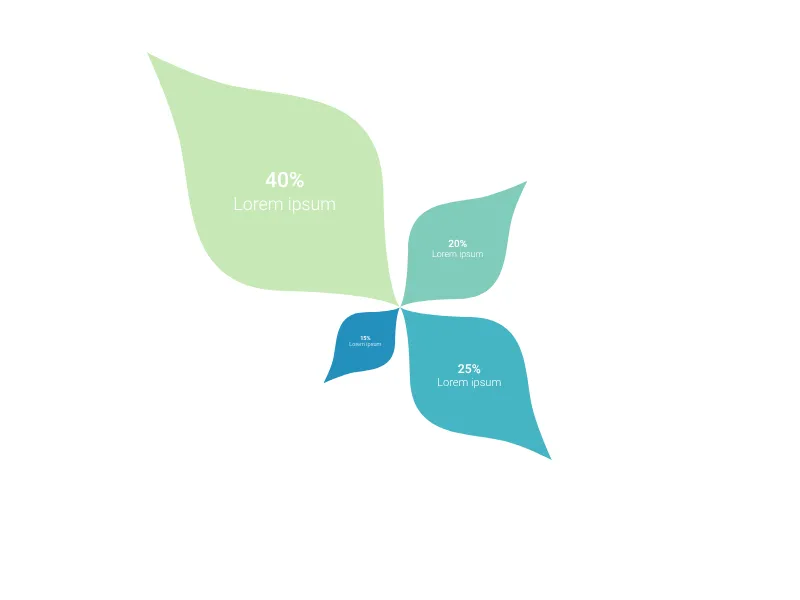
Present your data in a natural way with this beautiful leaf chart.
What is a leaf chart?
The Leaf Chart brings natural beauty to data visualization by representing information as beautifully rendered leaves of varying sizes. This organic visualization creates an immediate connection with nature while effectively communicating proportional data, making it perfect for presentations where you want to emphasize growth, sustainability, or natural harmony.
Key Features
- Natural metaphor: Beautiful leaf imagery creates positive, organic associations
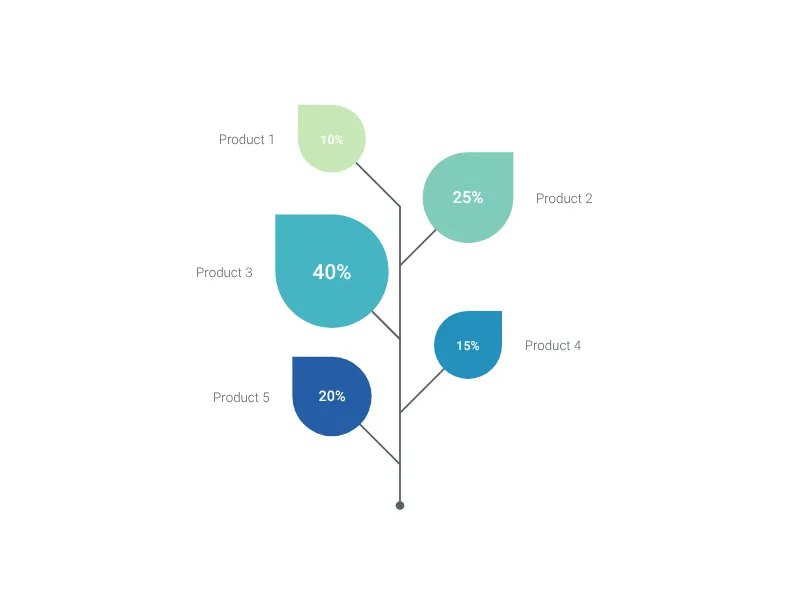
- Proportional sizing: Leaf sizes directly reflect data values for clear comparison
- Dual labeling: Each leaf supports both a primary title and descriptive subtitle
- Size scaling: Adjustable size values (1-10) for precise visual hierarchy
- Font scaling option: Text size can automatically scale with leaf size for optimal readability
- Limited scope: Focused on 1-4 leaves for maximum visual impact
Best Use Cases
- Environmental reporting: Perfect for sustainability metrics, carbon footprint data, or green initiatives
- Growth visualization: Show development, progress, or expansion using natural growth metaphors
- Portfolio analysis: Display investment or resource allocation with organic appeal
- Market segments: Represent different customer groups or market areas
- Product categories: Show product lines or service offerings with natural branding
- Team contributions: Visualize individual or group contributions to overall success
- Seasonal reporting: Quarterly or periodic results with natural cycle implications
Configuration Options
Customize your leaf visualization with thoughtful controls:
- Font scaling: Toggle whether text size scales proportionally with leaf size
- Individual sizing: Set precise size values (1-10) for each leaf
- Content hierarchy: Primary titles and supporting subtitles for each data point
Visual Appeal and Psychology
The leaf metaphor offers unique advantages:
- Positive associations: Leaves suggest growth, life, and renewal
- Natural hierarchy: Larger leaves naturally command more attention
- Organic harmony: Multiple leaves create a pleasing, balanced composition
- Environmental consciousness: Appeals to sustainability-minded audiences
- Seasonal relevance: Can be themed for different times of year
Design Considerations
- Size relationships: Ensure leaf sizes accurately reflect data proportions
- Visual balance: Arrange leaves for pleasing composition
- Color coordination: Choose colors that complement the natural theme
- Text legibility: Balance aesthetic appeal with information clarity
This visualization transforms dry statistics into a living, growing representation that audiences find both beautiful and memorable, making it particularly effective for organizations emphasizing natural values, growth, or environmental responsibility.
Leaf Chart: What's new?
Leaf Chart Alternatives
Use Cases
Pictorial chartsEnhance your productivity
Create a Leaf Chart directly in the tools you love
Create a Leaf Chart in PowerPoint with
Vizzlo's add-in
Loved by professionals around the world


Visualizations your audience won’t forget
Convey abstract concepts and data with professionally designed
charts and graphics you can easily edit and customize.