VORSCHAU
Chart Vizzard
Vizzlos KI-basierter Diagramm-Generator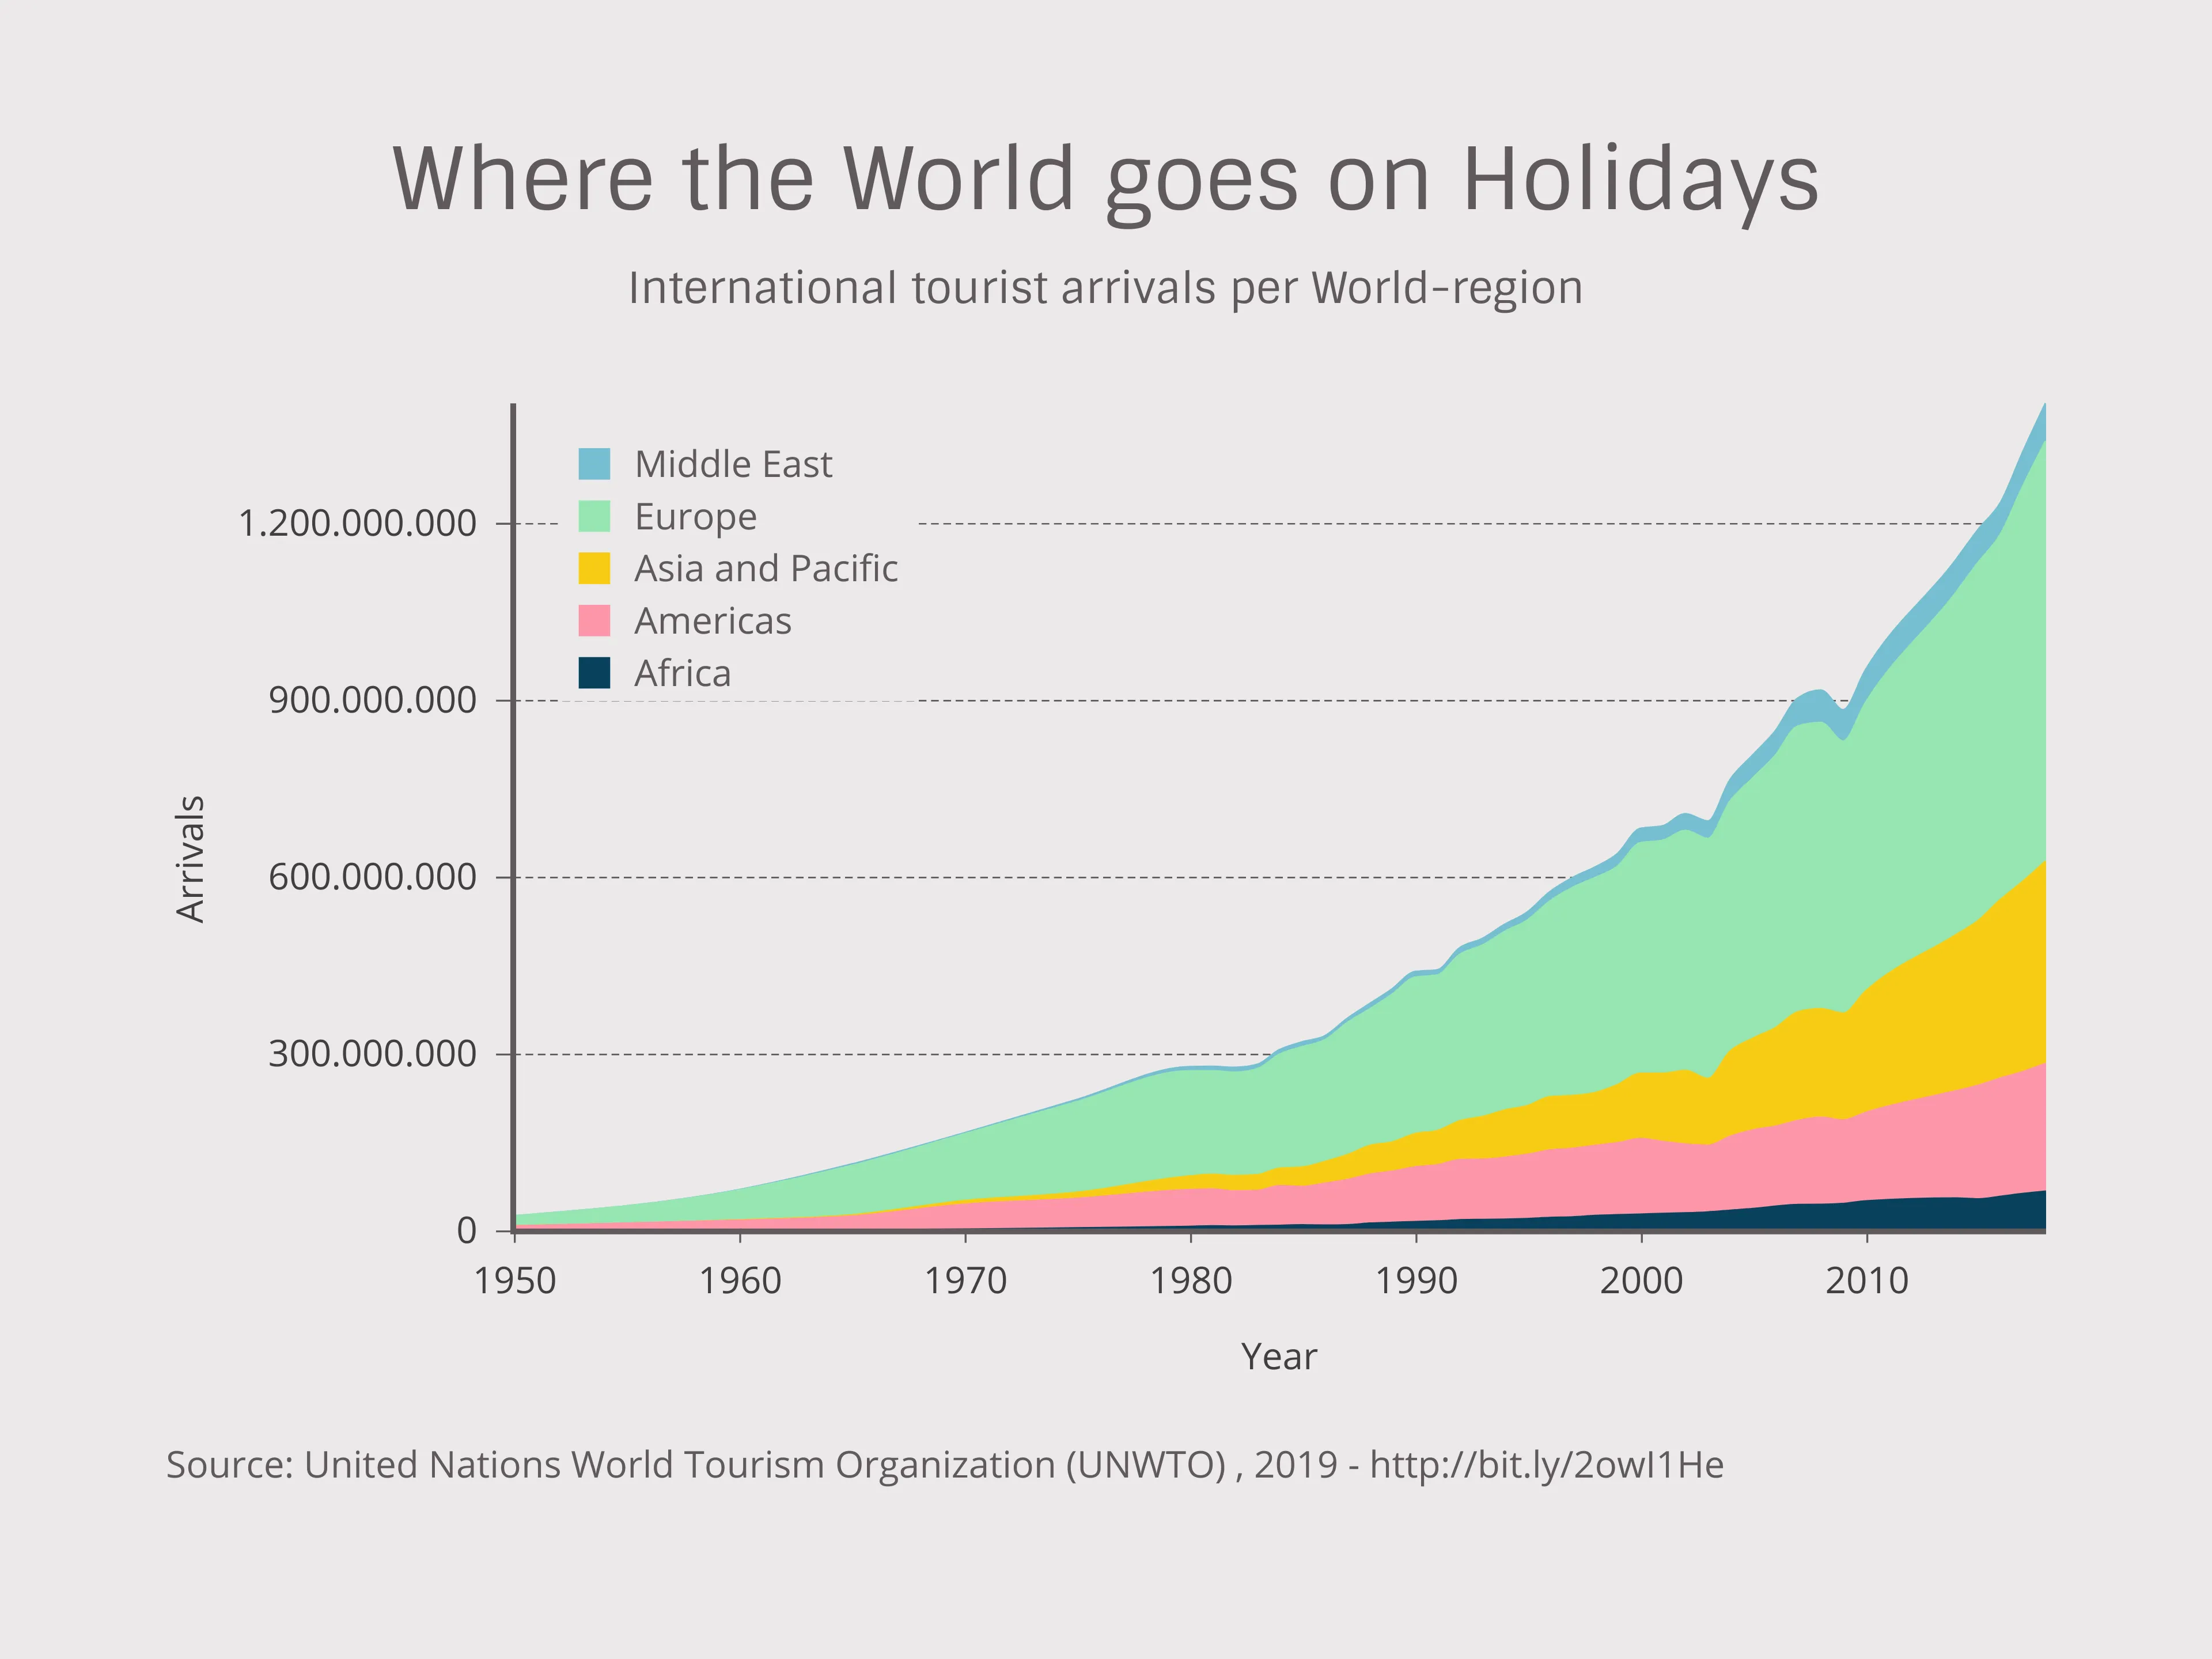
Where the World goes on Holidays
Over 1.4 billion tourists arrive at their destinations all around the globe every year! This graph shows the distribution among the continents and takes a look back at the growth of tourism in the last seventy years.
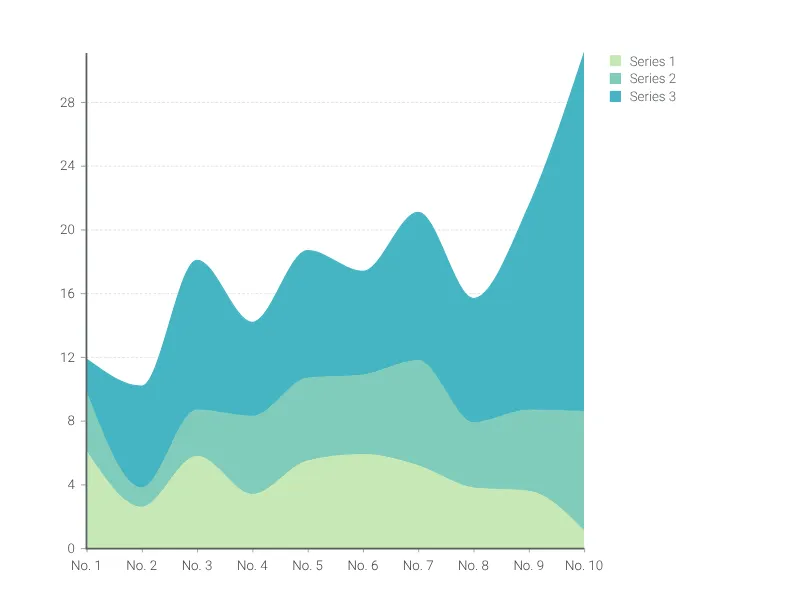
Dies ist ein Beispiel für Vizzlos "Gestapeltes Flächendiagramm"
Visualisieren Sie Veränderungen kumulativer Datenreihen mit dem gestapelten Flächendiagramm.