VORSCHAU
Chart Vizzard
Vizzlos KI-basierter Diagramm-Generator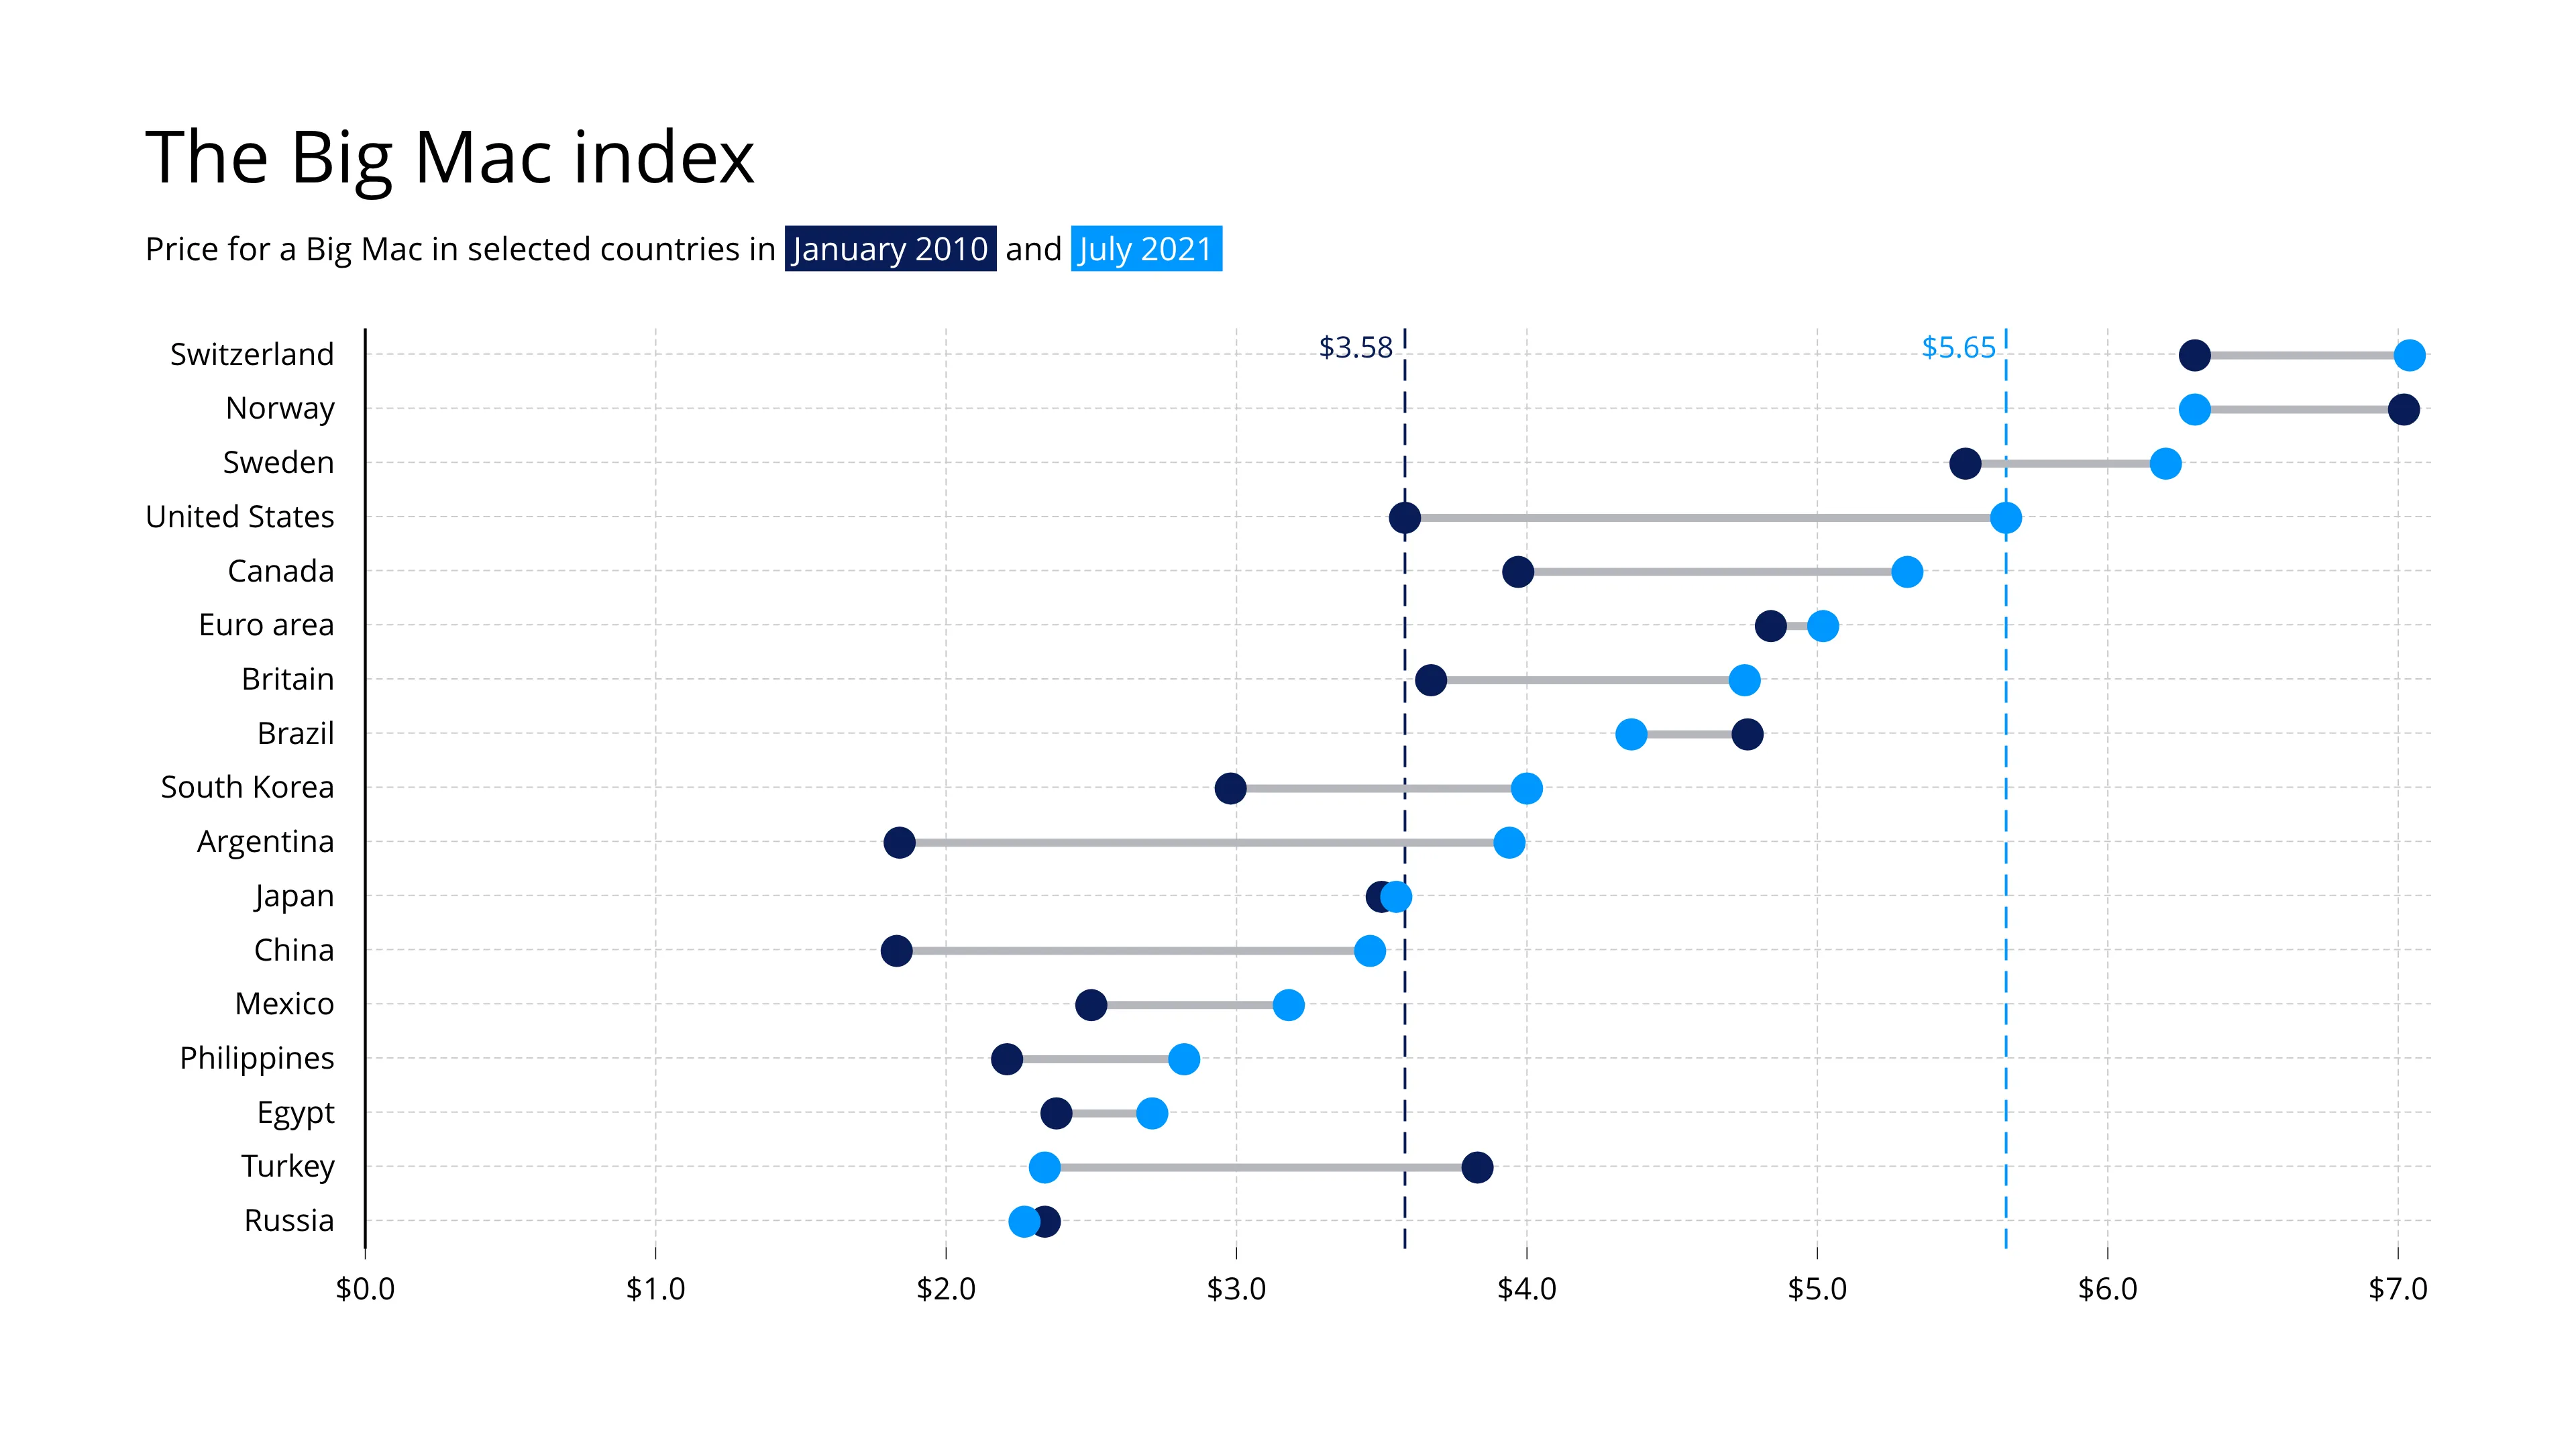
The Big Mac index
The Big Mac index was invented by The Economist in 1986 an informal way of measuring the purchasing power parity (PPP) between two currencies and provides a test if they are at their “correct” level. It “seeks to make exchange-rate theory a bit more digestible.”
For example, using figues in July 2021: the price of a Big Mac was $5.65 in the US and €4.27 in the Euro area. The implied purchasing power parity is $1.32 to €1, that is $5.65 / €4.27 = 1.32.
This compares with an actual exchange rate of $1.18 to €1 at the time, thus the euro was undervalued against the dollar by 11%.
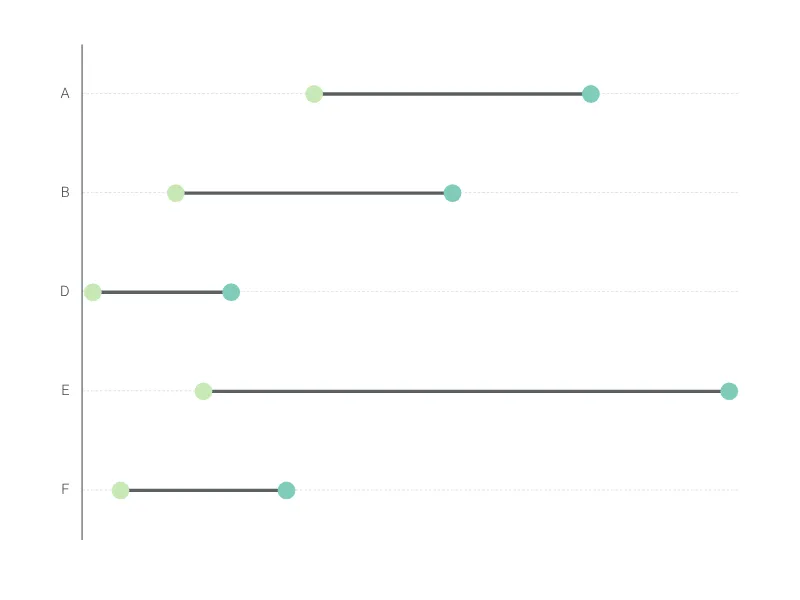
Dies ist ein Beispiel für Vizzlos "Spannweitendiagramm"
Ein Spannweitendiagramm ist die richtige Wahl, wenn Sie den Unterschied zwischen zwei Werten statt der Werte selbst hervorheben möchten.