VORSCHAU
Chart Vizzard
Vizzlos KI-basierter Diagramm-GeneratorHow many Streams make a Dollar?
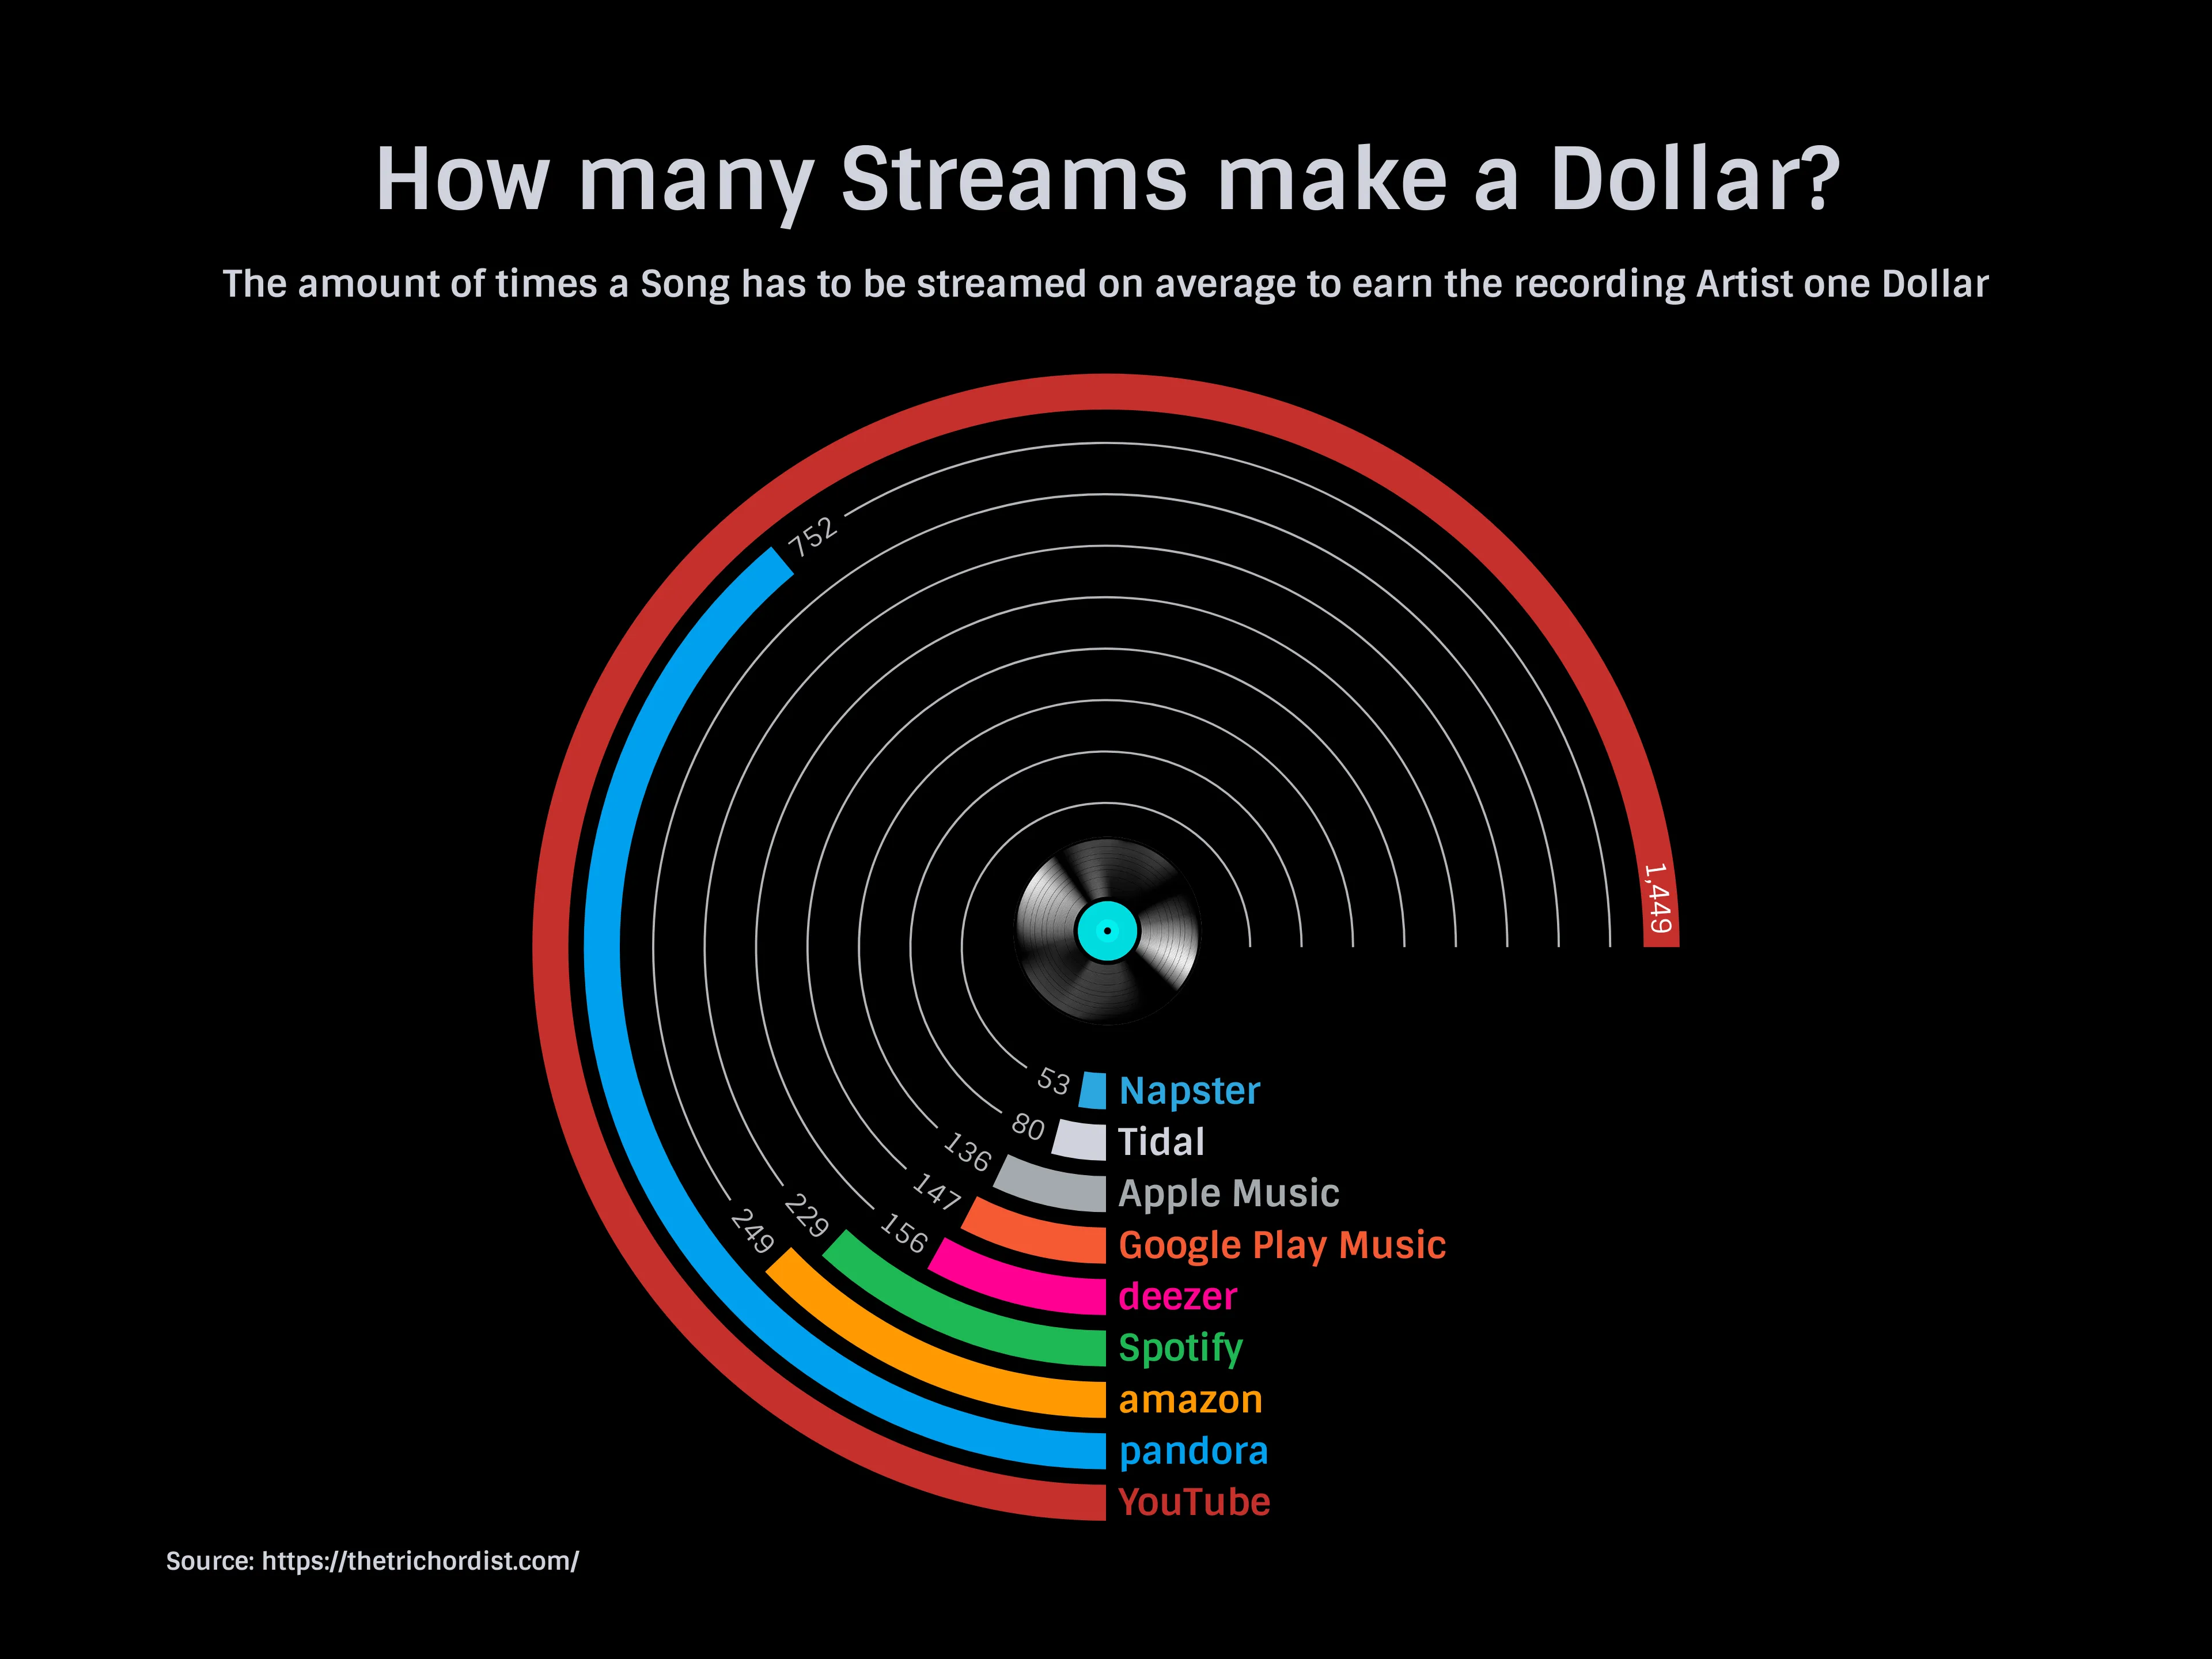
Streaming has for some time now been the main way of consuming music. That means it’s also the main source of revenue for artists and labels. So we wondered, how many streams does it take to earn you a dollar? The discrepancies across different services are pretty stunning.
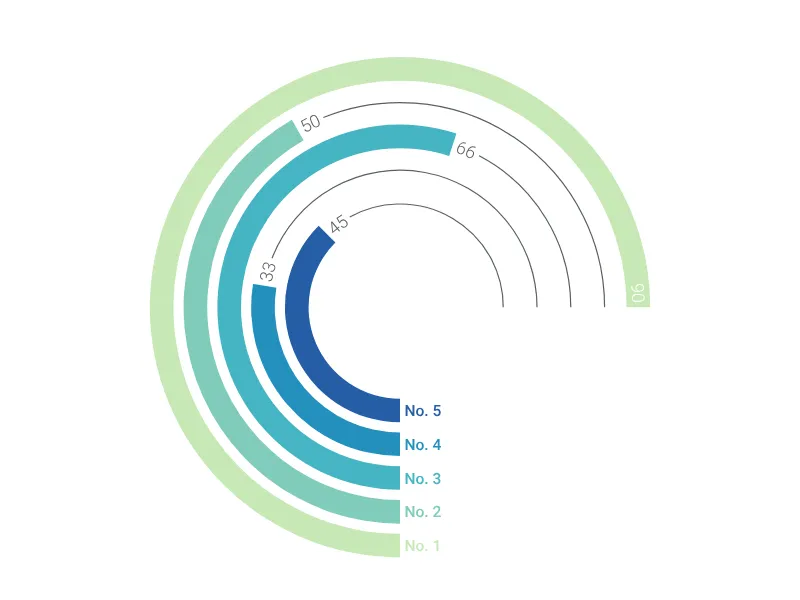
Dies ist ein Beispiel für Vizzlos "Radiales Balkendiagramm"
Dieses kreisförmige Balkendiagramm ist so stilvoll wie möglich für Ihre nächste Präsentation.
Balken- & Säulendiagramme Kreisdiagramme Messanzeigen- & Statusdiagramme