VORSCHAU
Chart Vizzard
Vizzlos KI-basierter Diagramm-GeneratorWireless Heaphones Won — But Wired Isn’t Dead
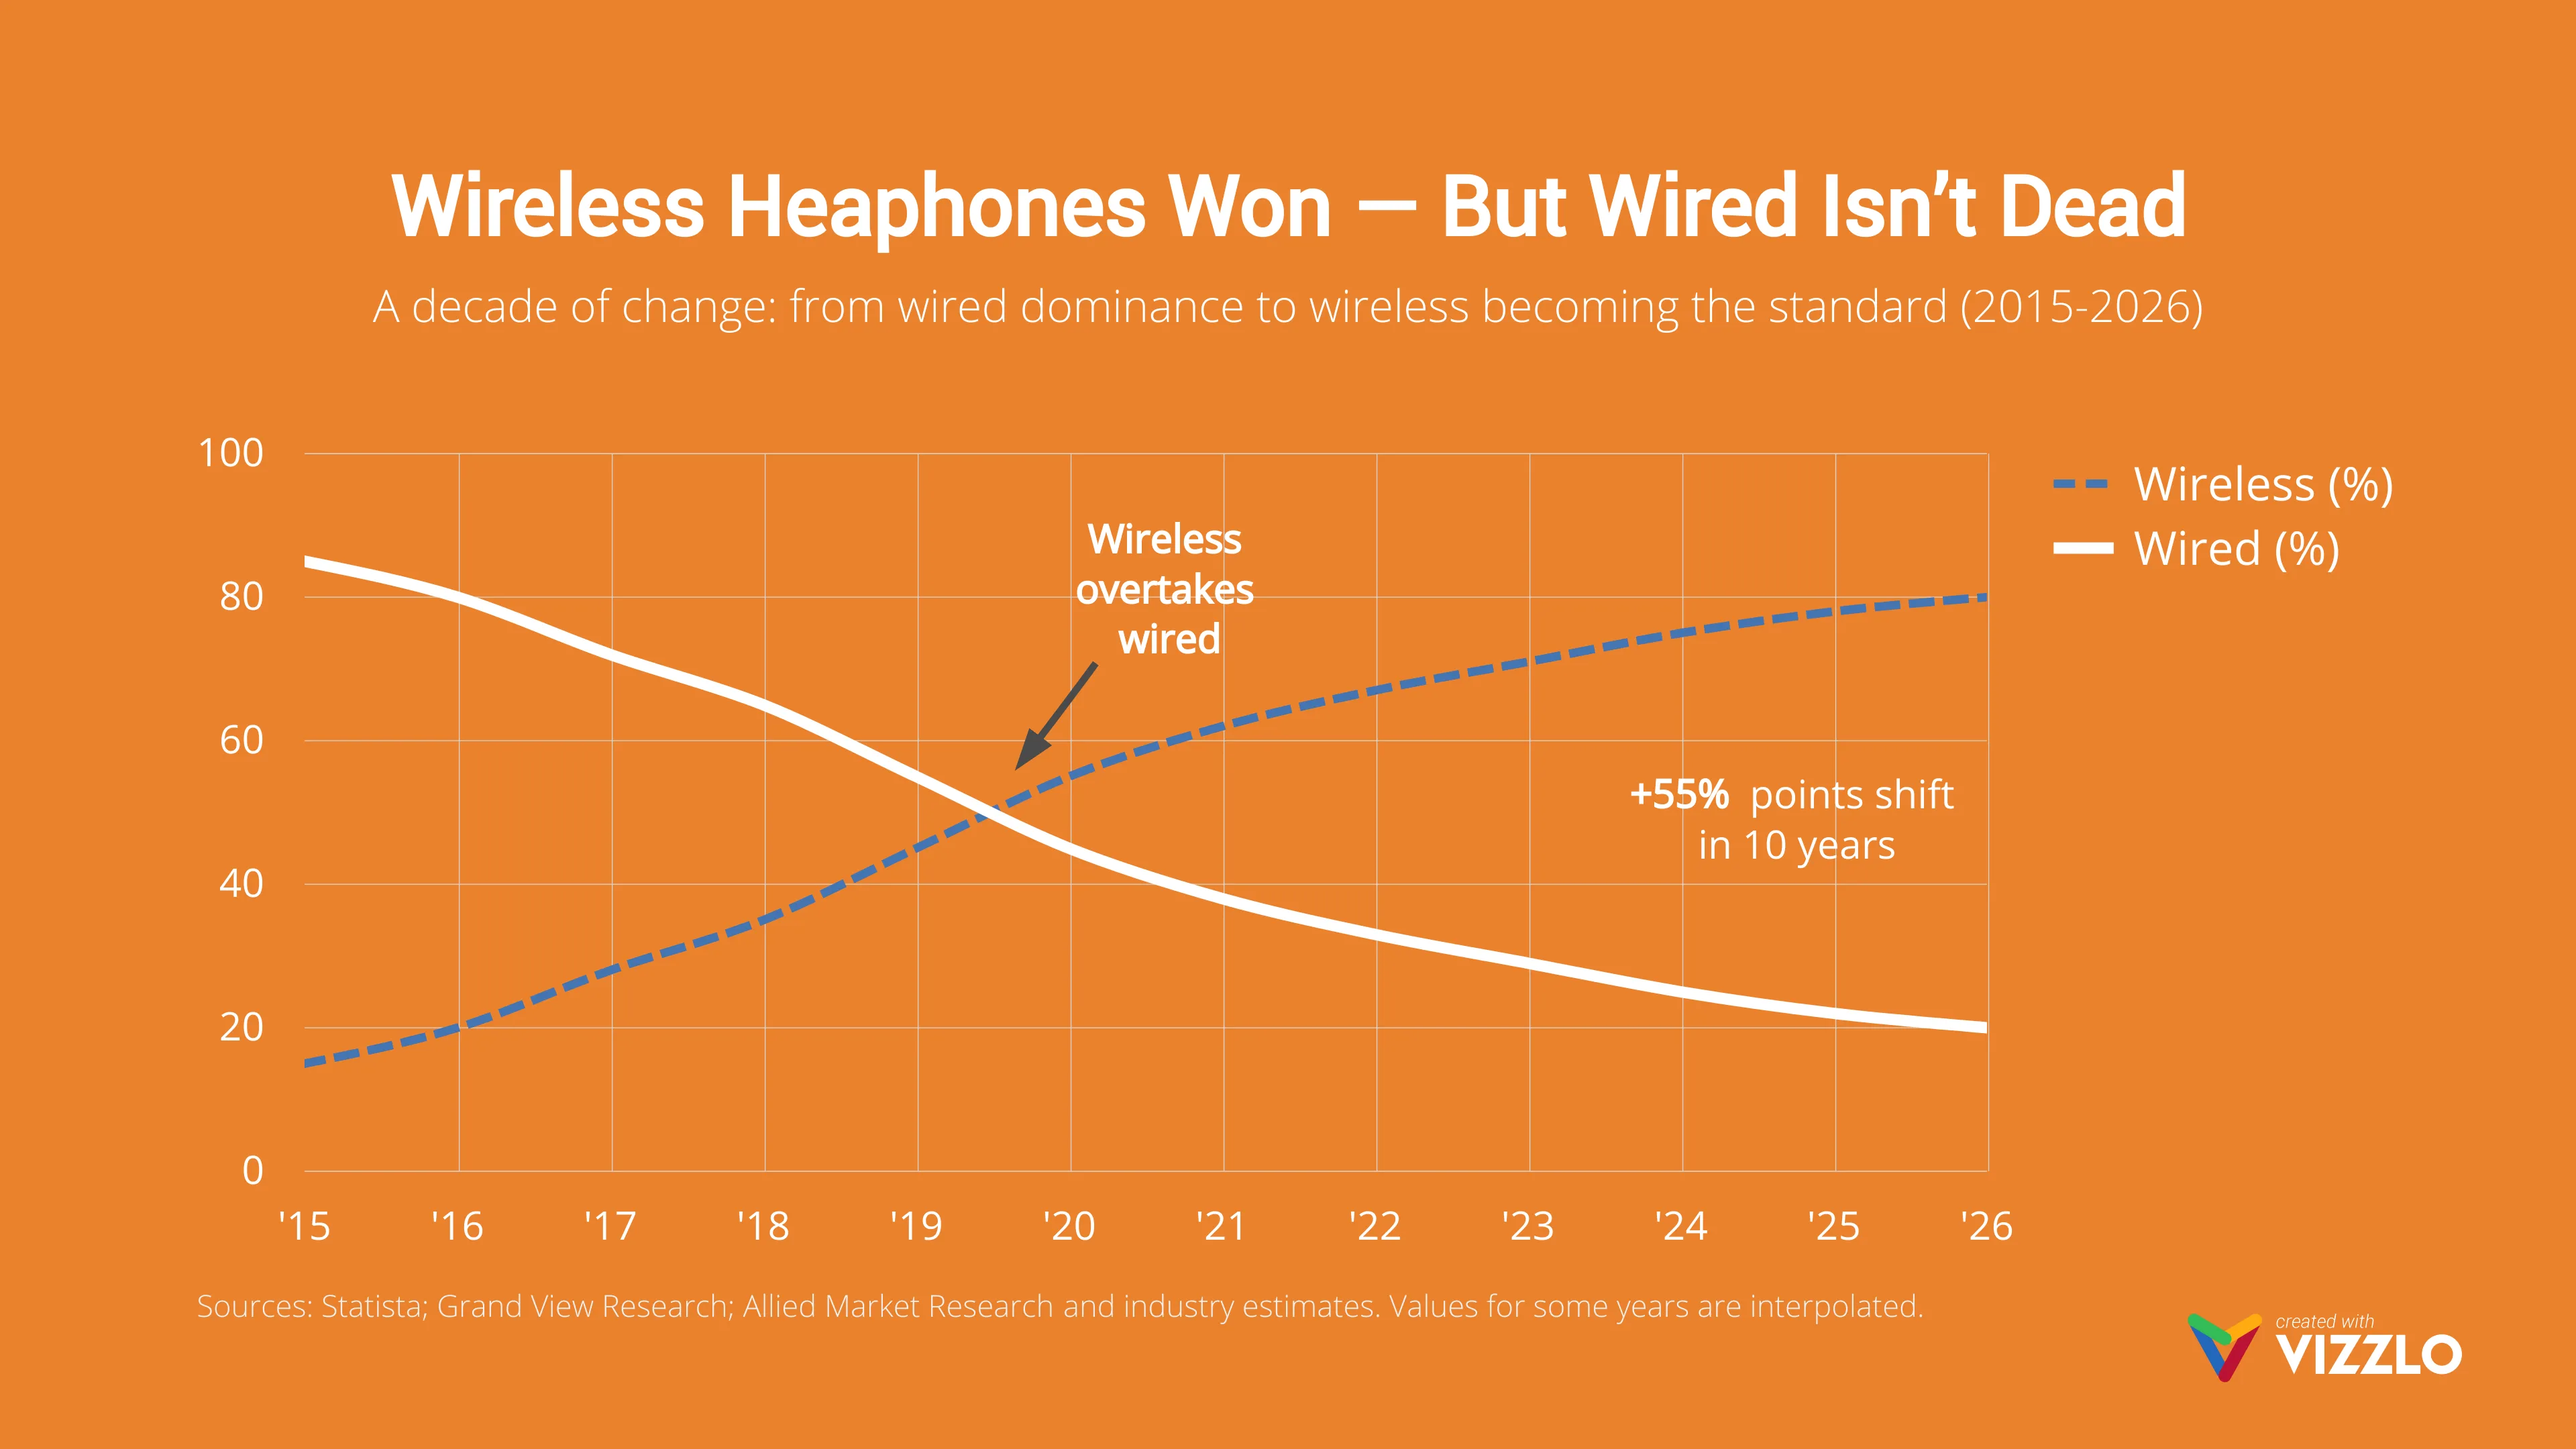
This line chart visualizes the shift from wired to wireless headphones over time, making it easy to compare market share trends and consumer adoption between both categories.
It highlights how wireless headphones steadily grow in popularity while wired headphones decline, with a clear crossover point around 2020 when wireless overtakes wired. This type of visualization is ideal for showing technology trends, market evolution, and changes in consumer behavior over time.
Relevant for topics such as wireless headphones, Bluetooth headphones, audio market trends, consumer electronics, tech adoption, and market share analysis.
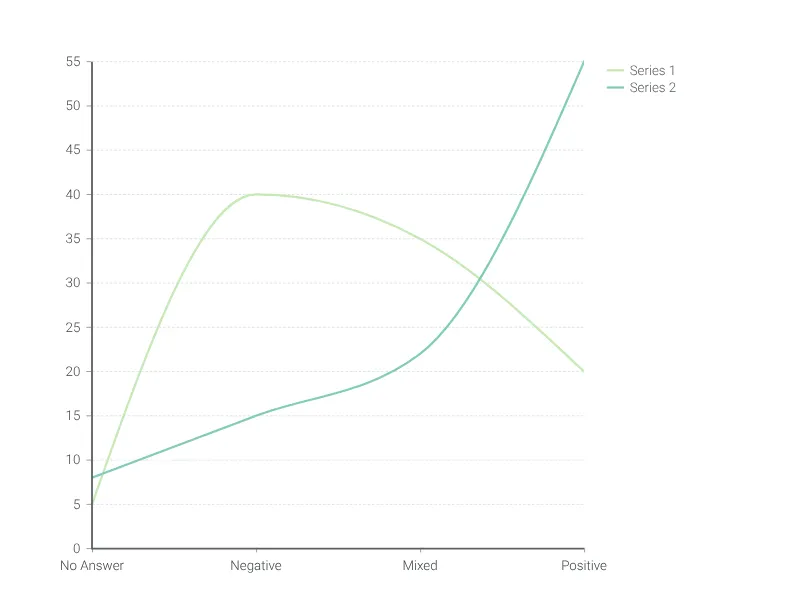
Dies ist ein Beispiel für Vizzlos "Liniendiagramm"
Ein einfacher, schneller und vielseitiger Liniendiagramm-Editor.