Chart Vizzard
Vizzlos KI-basierter Diagramm-Generator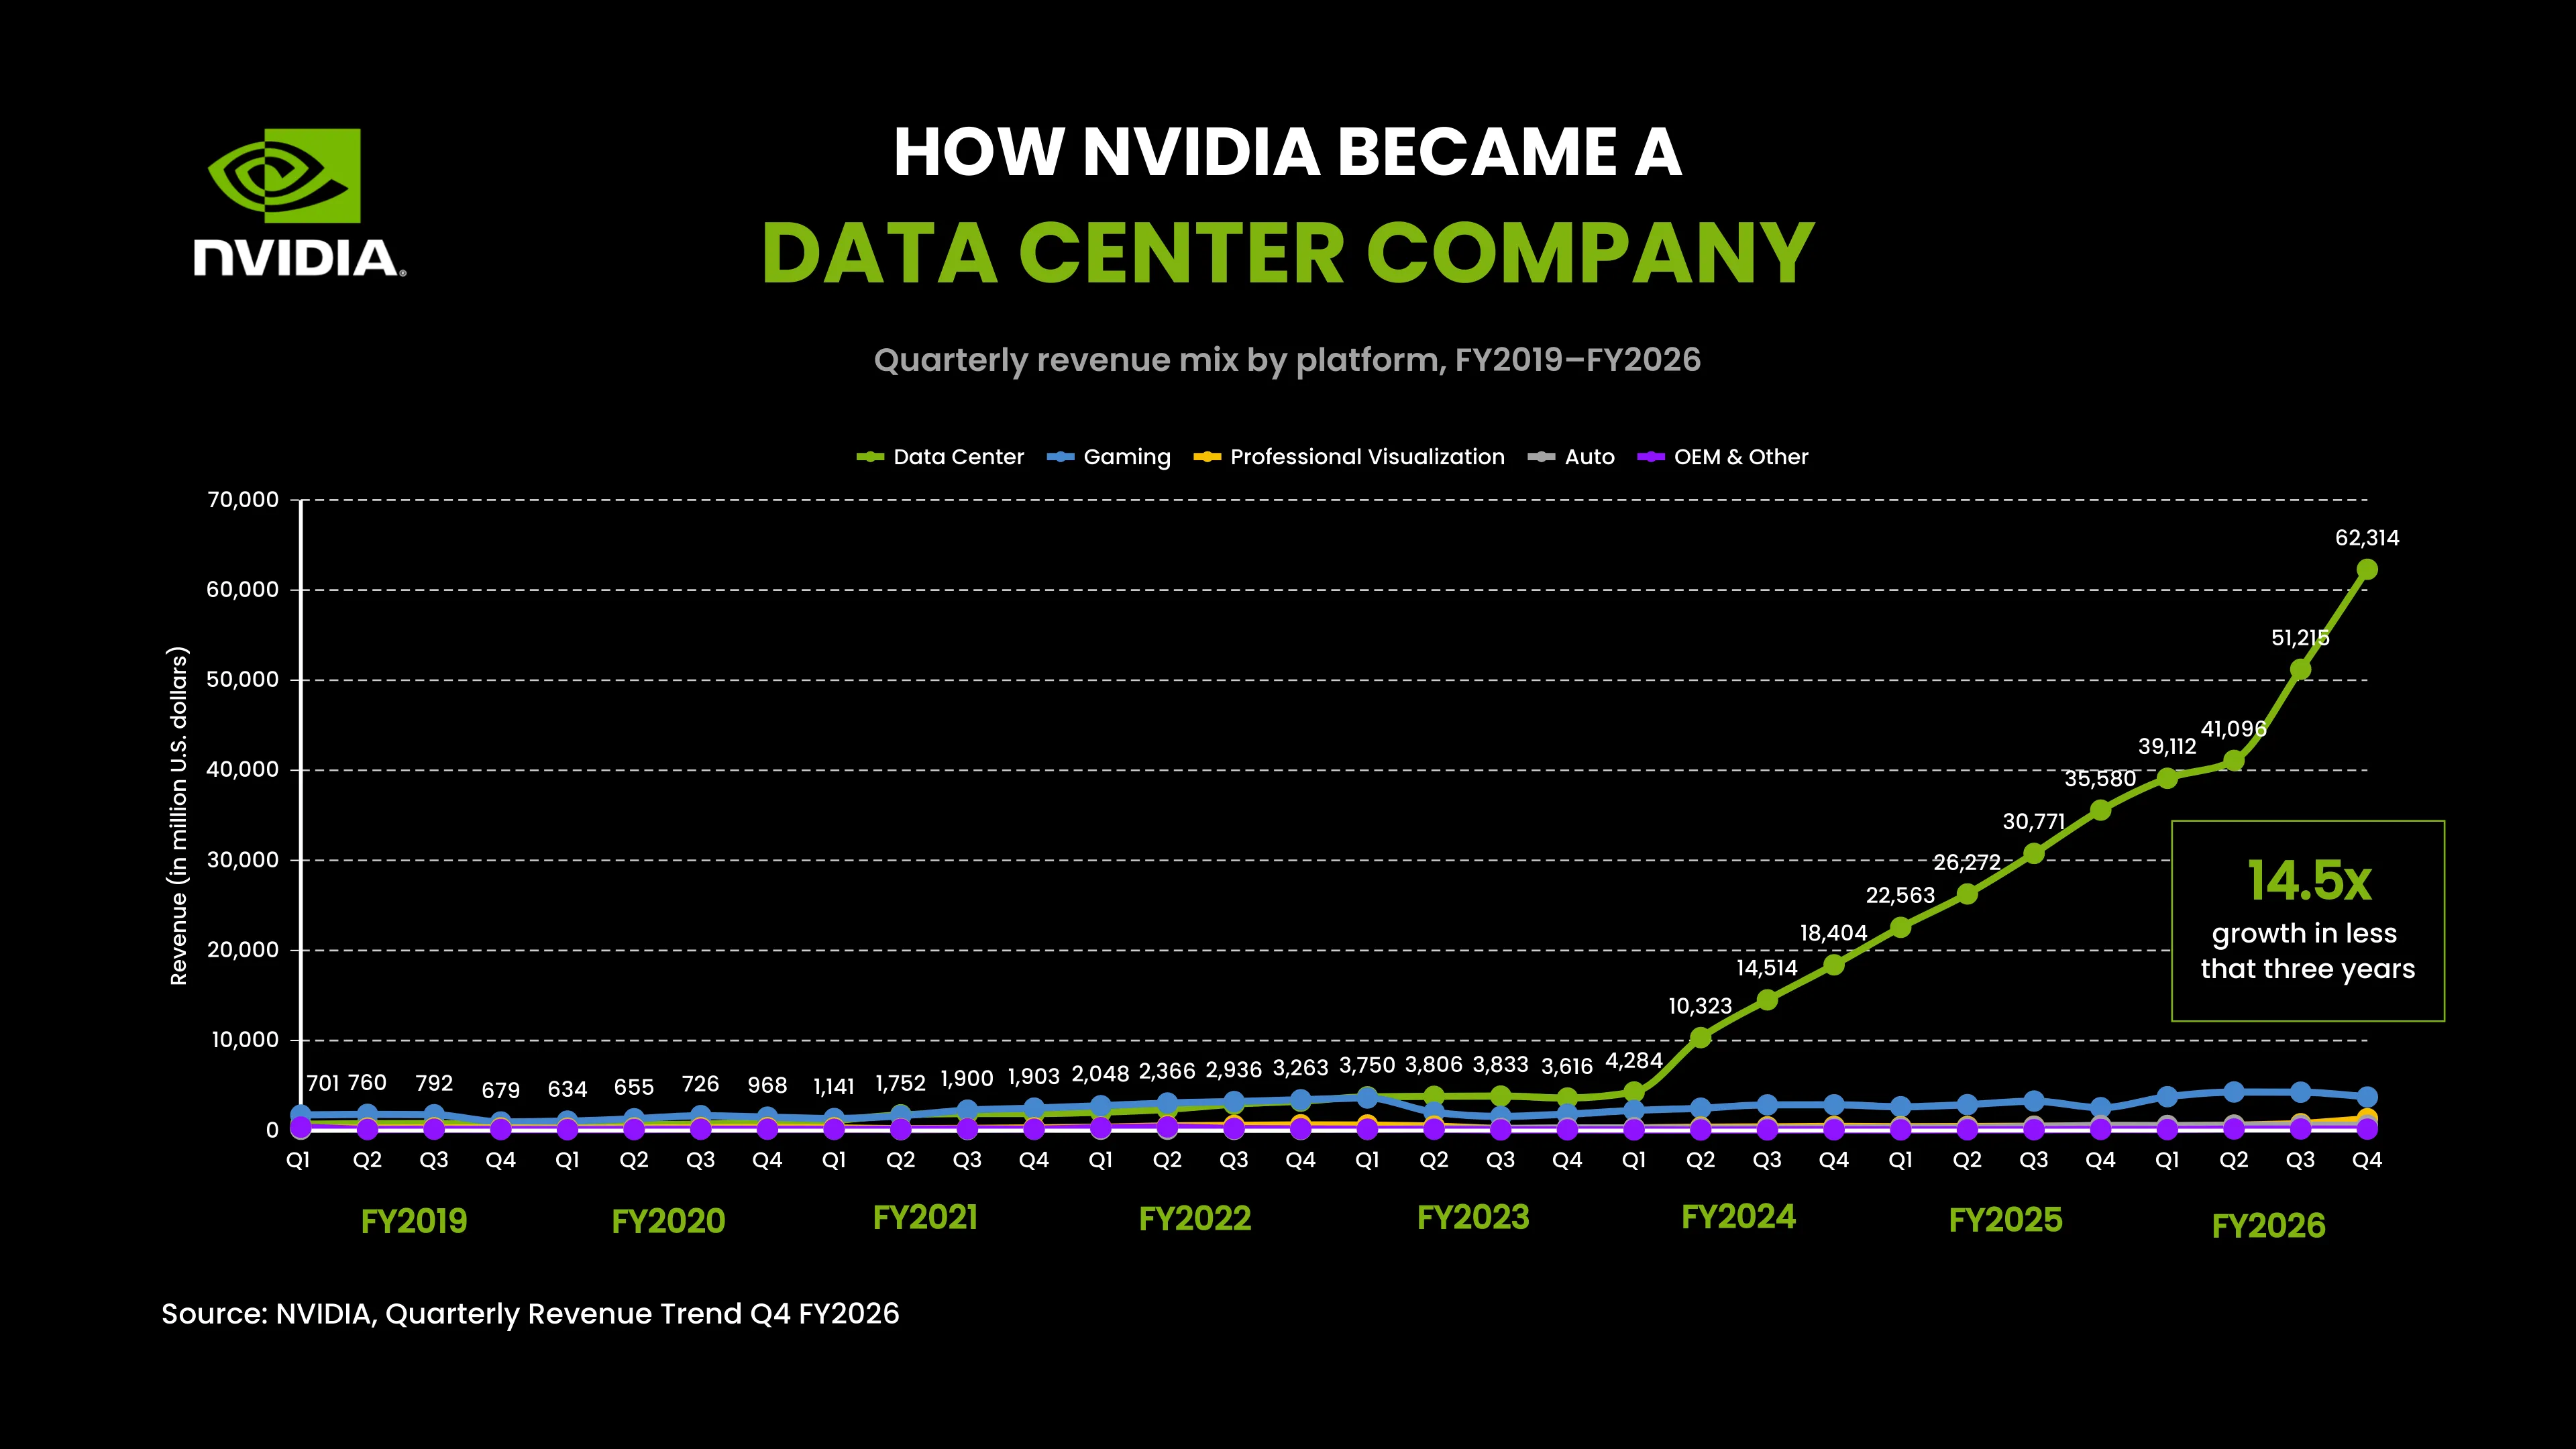
HOW NVIDIA BECAME A DATA CENTER COMPANY
NVIDIA Revenue by Platform (FY2019–FY2026) is a line graph that visualizes how NVIDIA’s quarterly revenue evolved across its major business segments, including Data Center, Gaming, Professional Visualization, Automotive, and OEM & Other. The graph highlights the extraordinary rise of Data Center revenue, which grew from $701 million in Q1 FY2019 to $62.3 billion in Q4 FY2026.
The visualization shows how NVIDIA’s business transformed over this period. While Gaming was historically one of the company’s largest revenue drivers, the rapid expansion of artificial intelligence and accelerated computing drove unprecedented demand for NVIDIA’s data center products. From FY2024 onward, Data Center revenue increased sharply, becoming by far the company’s largest business segment.
By connecting quarterly values over time, the line graph makes it easy to identify trends, turning points, and differences in growth between business segments. Line graphs are particularly useful for visualizing financial performance, sales trends, market development, and other time-series data where changes over time are the main focus.
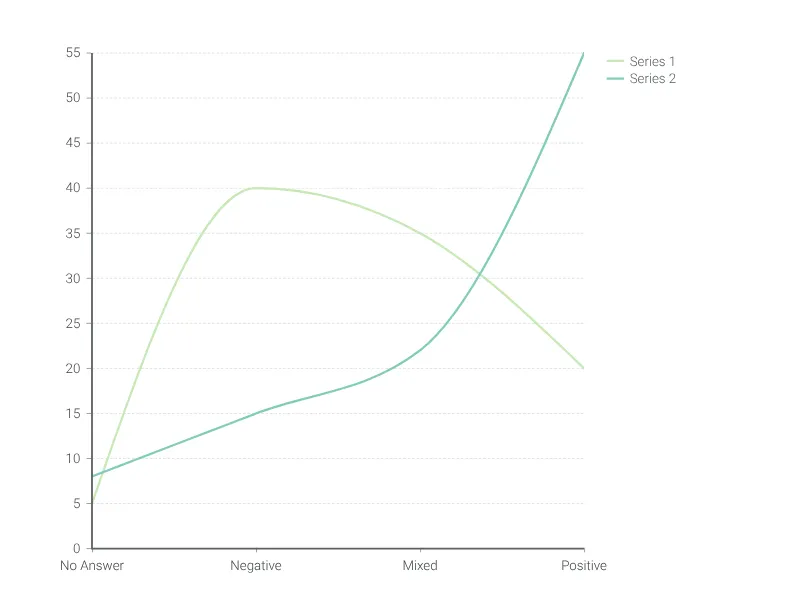
Dies ist ein Beispiel für Vizzlos "Liniendiagramm"
Ein einfacher, schneller und vielseitiger Liniendiagramm-Editor.